


Abstract
Objectives
Lower limb muscle power is thought to influence outcome following total knee replacement (TKR). Post-operative deficits in muscle strength are commonly reported, although not explained. We hypothesised that post-operative recovery of lower limb muscle power would be influenced by the number of satellite cells in the quadriceps muscle at time of surgery.
Methods
Biopsies were obtained from 29 patients undergoing TKR. Power output was assessed pre-operatively and at six and 26 weeks post-operatively with a Leg Extensor Power Rig and data were scaled for body weight. Satellite cell content was assessed in two separate analyses, the first cohort (n = 18) using immunohistochemistry and the second (n = 11) by a new quantitative polymerase chain reaction (q-PCR) protocol for Pax-7 (generic satellite cell marker) and Neural Cell Adhesion Molecule (NCAM; marker of activated cells).
Results
A significant improvement in power output was observed post-operatively with a mean improvement of 19.7 W (95% confidence interval (CI) 14.43 to 30.07; p < 0.001) in the first cohort and 27.5 W (95% CI 13.2 to 41.9; p = 0.002) in the second. A strong correlation was noted between satellite cell number (immunohistochemistry) and improvement in patient power output (r = 0.64, p = 0.008). Strong correlation was also observed between the expression of Pax-7 and power output (r = 0.79, p = 0.004), and the expression of NCAM and power output (r = 0.84, p = 0.001). The generic marker explained 58% of the variation in power output, and the marker of activated cells 67%.
Conclusions
Muscle satellite cell content may determine improvement in lower limb power generation (and thus function) following TKR.
Article focus
Although a highly successful procedure, a number of patients report suboptimal physical function following total knee replacement (TKR). Loss of muscle function compared with healthy age-matched controls has been well demonstrated, but simple models of muscle atrophy have not satisfactorily explained this
We hypothesised that the intrinsic ability of the patient’s musculature to regenerate would influence physical recovery, with the variation in recovered muscle power influenced by the underlying number of muscle satellite cells
Key messages
Variation in muscle satellite cell content of the quadriceps muscle was found between TKR patients using separate immunohistochemistry and molecular techniques to identify the cells
Variation in satellite cell content accounted for much of the variance of the change in the patient’s physical performance in the early post-operative period, ten-times the variance explained by measures of pre-operative muscle power
Strengths and limitations
This is the first assessment as to the impact of muscle satellite cell content to physical recovery following TKR
A particular strength of this paper is the linking of molecular mechanisms with resultant function in a clinical population
A limitation of this analysis is that a single muscle biopsy was taken at the time of surgery, thus any change in the patients satellite cell content with recovery could not be assessed. We suggest this as a focus of future investigation
Introduction
The mechanisms involved in the regulation of skeletal muscle growth and regeneration are of great interest, as it is believed that these may be manipulated to improve the quality of life of individuals suffering from conditions as diverse as muscular dystrophy, chronic heart failure and sarcopenia.1 In the field of orthopaedics, improved regeneration of skeletal muscle would also have direct and tangible benefits through enhanced patient outcome following surgery; to date this has not been investigated.
A large patient population who may benefit from advances in muscle regeneration are those undergoing total knee replacement (TKR), as quadriceps muscle function is recognised as paramount to subsequent rehabilitation and eventual outcome.2 Though a highly successful procedure, some TKR patients report suboptimal function post-operatively.3,4 It is known that lower limb power affects physical functioning following knee arthroplasty,5 and clinically it has been reported that pre-operative physical ability is relevant to post-operative physical outcome.6-8 Quadriceps muscle weakness is often reported following surgery of the knee, and deficits of up to 30% (compared with age-matched controls) have been demonstrated in TKR patients.9 Muscle atrophy alone is not able to explain this discrepancy.10 An inability to activate the quadriceps muscle completely has been postulated as a focal cause of chronic quadriceps weakness after TKR,10 but convincing data is lacking. No consideration has been given to the mechanisms by which the muscle recovers post-operatively, or its ‘regenerative potential’.
Studitsky11 in 1964 reported that a muscle removed, minced and then returned to its original site was able to regenerate into a functional muscle, a capacity attributable to the muscle satellite cell.12 However, Jones and Round13 note a widespread belief that muscle is not able to regenerate following injury. The satellite cell is an undifferentiated myogenic precursor, which sits quiescently under the basal lamina and proliferates following injury to repair the damaged muscle fibre.14 In normal muscle these cells respond to regenerative cues such as injury or exercise to provide new myonuclei for the homeostasis, hypertrophy or repair of muscle fibres. Importantly, these cells also self-renew in order to maintain a viable ‘stem-cell’ pool that is able to respond to repeated demand.13,15 It has been suggested that the number of satellite cells in an individual is variable and factors such as ageing16-18 and history of exercise19-21 can affect this number.
The regulation of satellite cell proliferation and differentiation is not completely understood. The Pax7 gene is considered to regulate the entry of quiescent satellite cells into the myogenic programme and the neural cell adhesion molecule (NCAM) is associated with activated cells. In the few human studies conducted, immunohistochemical antibody staining against either Pax7 or NCAM has been used to identify the cells.16-20 Molecular assessment of muscle satellite cells using quantitative polymerase chain reaction (qPCR) to quantify Pax7 and NCAM markers has not been described.
It was hypothesised that the differing levels of recovery of muscle power would be influenced by the number of satellite cells in the quadriceps muscle. In addition our secondary objective was to develop a quantitative molecular method by which to assess satellite cell content in a muscle sample.
Materials and Methods
Patient recruitment
A pragmatic trial design was adopted through which we invited consecutive patients who had been listed for TKR from the clinics of a single orthopaedic surgeon (PG) to take part in the study. Inclusion criteria were TKR for osteoarthritis and the ability to provide informed consent. Exclusion criteria were the presence of comorbidities that would affect post-operative recovery or subsequent physical performance, such as cardiovascular or neurological disease, and failure to meet the inclusion criteria. Patients were recruited over a single calendar year. Of 54 patients, 29 met the inclusion criteria and agreed to participate. Two patients were subsequently withdrawn with medical complications following surgery that prohibited functional evaluation, although their muscle samples are included in the analysis. Local ethical approval was granted by the Lothian Research Ethics Committee.
Power output assessment
Specific evaluation of the recovery of muscle strength was assessed by use of a Leg Extensor Power Rig (Queens Medical Centre, Nottingham, United Kingdom), which has been validated with this population group.5,22,23 The apparatus consists of a seat and footplate connected via a lever and chain to a flywheel. Application of force accelerates the flywheel from rest, and output is recorded as both maximal wattage (W) generated and as relative power–bodyweight ratio (%) of a single leg extension. The test procedure was conducted as per the manufacturer’s instructions. The highest recorded output was used for analysis.24 Those not able to complete the test were assigned a score of zero.5 Body weight (kg) was measured separately at each time point using a calibrated set of mechanical medical grade floor scales (SECA, Hamburg, Germany). Baseline power output was determined pre-operatively and then subsequently at routine clinical review at six and 26 weeks post-operatively.
Muscle sampling
A muscle sample was obtained from the distal quadriceps during the surgical procedure via the surgeon’s routine incision. The sample site was standardised. The biopsy was obtained 5 cm proximal to the superior pole of the patella, dependent on the tissue quality of the individual. The initial 18 samples were immediately fixed in 10% neutral buffered formalin (4% formaldehyde in phosphate buffered saline) and kept in a fridge for 24 hours, before subsequent immersion in 70% ethanol and embedding in paraffin wax for immunohistological analysis. The 11 further muscle samples were immediately snap frozen in liquid nitrogen before immersion in RNAlater ice (Ambion, Austin, Texas) to preserve the RNA and stored at -80°C for qPCR analysis. An additional control biopsy of quadriceps was obtained from a similar site in the muscle of a healthy young adult patient aged 22 years undergoing surgery to equalise limb lengths.
Immunohistochemistry
Biopsies that had been wax embedded underwent a standard de-waxing protocol, using xylene and graded ethanol baths before antigen retrieval using sodium citrate. Sections were loaded onto sequenza plates and washed in phosphate buffered saline (PBS; without calcium and magnesium) before adding three drops Protein Block (AMS biotechnology, Abingdon-on-Thames, United Kingdom) solution for 30 minutes at room temperature. Primary mouse anti-human Pax7 antibodies (Abcam, Cambridge, United Kingdom) were diluted (1:150) in the protein block solution and 250 µl was added to each slide for one hour at room temperature. The slides were washed three times in PBS, and 1:500 diluted Alexa Fluor goat anti-mouse 488 (Invitrogen, Paisley, United Kingdom) secondary antibody added for 30 minutes at room temperature in the dark. The slides received a further four washes in PBS before dehydrating them in 100% ethanol and air drying. The slides were then mounted with vectashield hardest mounting medium with DAPI for fluorescence (Vector laboratories, Peterborough, United Kingdom). In order to ensure antibody-specific staining, a control experiment was run in parallel that followed the exact protocol, excluding the primary antibody. Positive cells were identified on the basis of immunofluorescent staining in association with nuclear material, and confirmed by their position under the basal lamina (Fig. 1a). Positive cells superficial to the basal lamina were not counted.
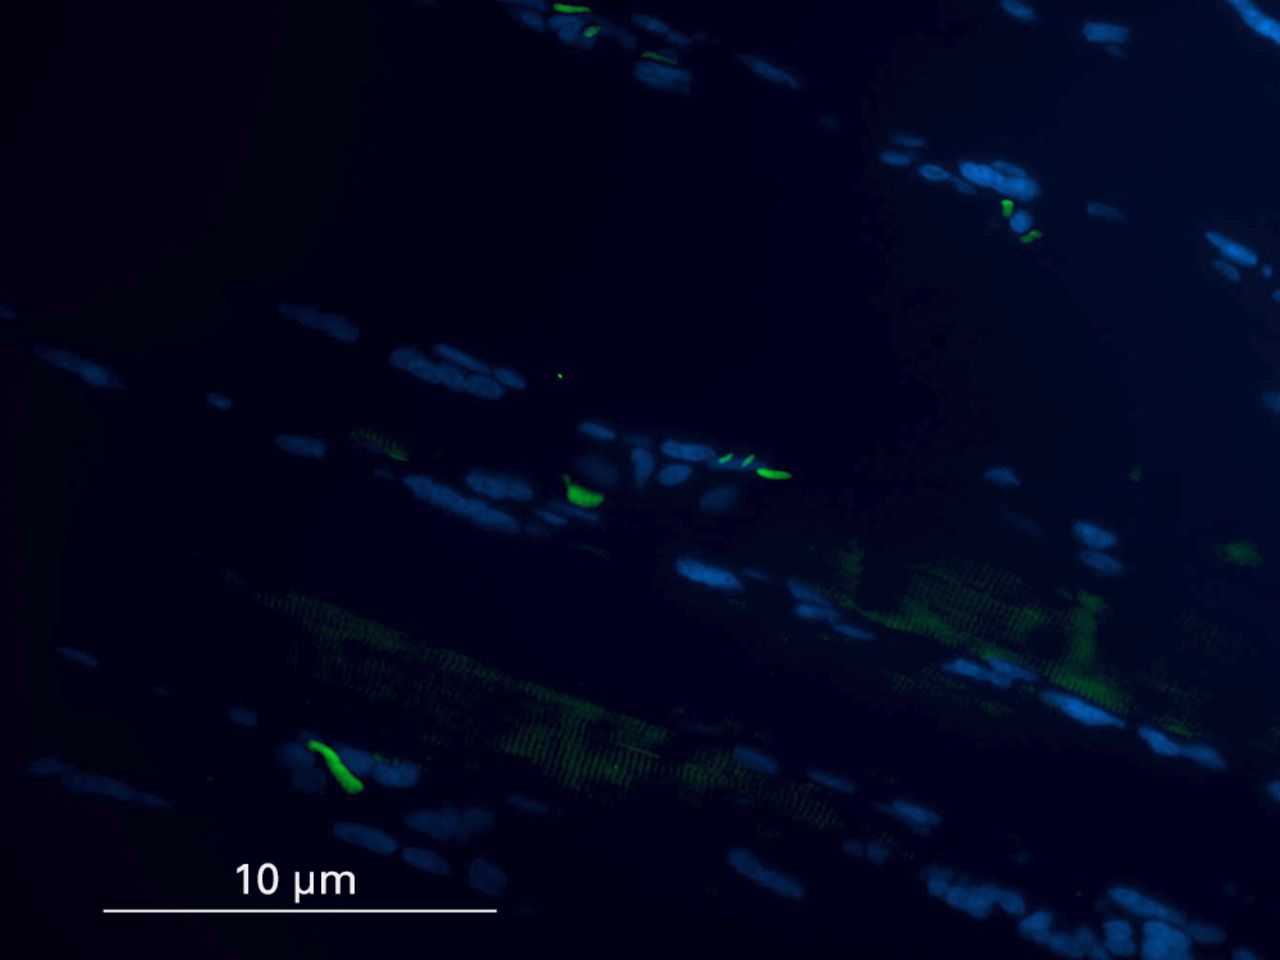


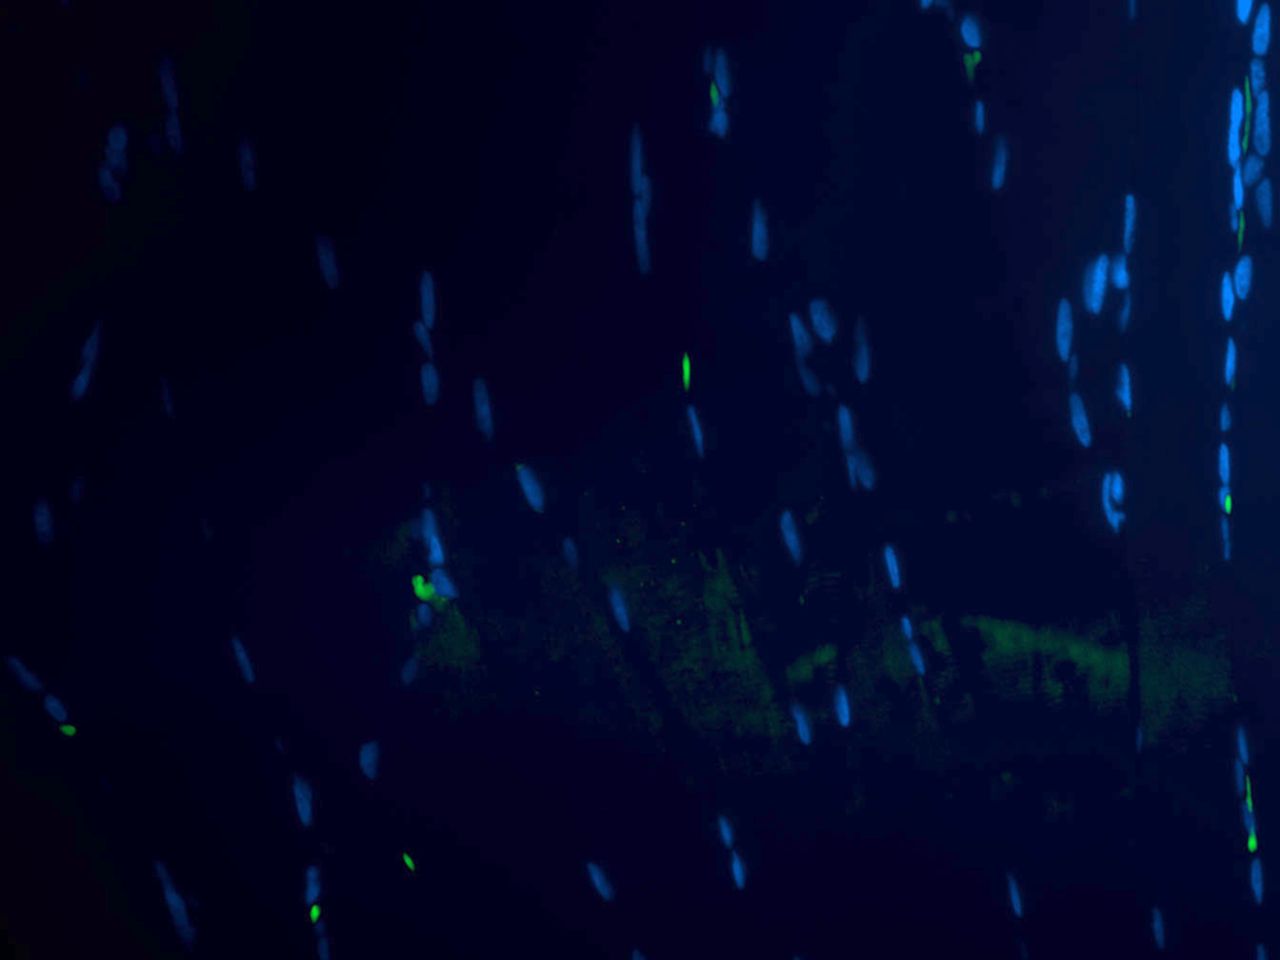
Figs. 1a - 1d
Histological images showing the identification of muscle satellite cells by immunofluorescence. Satellite cells are marked with Pax7 antibody (green) and myonuclei with DAPI (blue). In cases where the final image confirmed the presence of a Pax7 positive cell and DAPI, but location under the sarcolemma was in question, care was taken to examine the muscle architecture, and cells superficial to the basal lamina were not counted.
Imaging and cell counting
Images of the sections were captured on a Zeiss Axioscope II MOT (Zeiss, Oberkochen, Germany) compound microscope under a 20 × objective equipped with a Hamamatsu Camera Controller ORCA-ERE (Hamamatsu Corp., Hamamatsu, Japan) and OpenLab 4.0 image analysis software (ImproVision, Coventry, United Kingdom). Fluorescent images were then merged using Photoshop (Adobe Systems, San Jose, California). Positive identification of satellite cells was determined by immunofluorescent staining in association with nuclear material, and by position under the basal lamina. Three separate areas of each section were imaged. In each image, the number of muscle fibres, satellite cells and myonuclei were counted, and an average of three cell counts per section were used for analysis. The positive staining index (PSI) was calculated (no. of satellite cells/total no. of myonuclei × 100). Cell counting was performed by a single individual blinded to the patient identity until the analysis was complete.
RNA extraction and cDNA production
Before RNA extraction the 12 samples were thawed at -20°C for 24 hrs. Whole muscle tissue was homogenised and RNA was extracted using nucleospin columns (Macheray Nagel, Duren, Germany) according to the kit protocol. The RNA yielded was quantified by nanodrop spectrophotometer (Thermoscientific, Beverley, Massachusetts) and cDNA was produced using a high capacity cDNA reverse transcription kit (Applied Biosystems, Foster City, California) following the kit protocol for q-PCR analysis.
Quantitative-PCR analysis
Intron spanning primers were designed for the satellite cell markers Pax7 (Forward primer 5′gggattccctttggaagtgt3′, Reverse primer 5′cgcccattgatgaagacc3′) and NCAM (Forward primer 5′aagacgcagccagtccaa3′, Reverse primer 5′tgcttgatcaggttcactttaataga3′). An 18S (ribosomal RNA) primer was used as the housekeeping gene: RT-PCR 18S control kit (Eurogentec, Liege, Belgium). In order to quantify gene expression in human muscle tissue, each reaction contained 10 µl of Syber Green (iTaq SYBR Green Supermix with rox (BioRad, Hertfordshire, United Kingdom)) 7 µl of water, 1 µl of forward primer, 1 µl of reverse primer (Eurogentec) added to 1 µl of cDNA. This was loaded in duplicate wells on q-PCR plates (Applied Biosystems) for each sample and run on a 7500 Fast Real-time PCR machine (Applied Biosystems). The following PCR cycling conditions were used for amplification: 50˚C 2 min, 95˚C 10 min, then 40 cycles of 95°C 15 s and 60°C 1 min. A dissociation step of 95°C for 15 s, 60°C for 1 min and 95°C for 15 s was performed at the same time to check for primer specificity and ensure that false positive products were not generated during the amplification. Pax7 and NCAM were normalised to the level of the 18S housekeeping control gene and quantification of each gene was performed using the 2-ΔΔcT calculation and expressed relative to the control sample from a young patient who had healthy muscle tissue. This allowed quantification of the content of the satellite cell markers expressed in individual arthroplasty patients against an artificial ‘zero’ obtained from a young healthy control.
Statistical analysis
Data were assessed with the Minitab v15 (Minitab Inc., State College, Pennsylvania) software. All data was assessed visually for normality. Differences in power outcome scores were assessed by paired sample t-tests. Correlation between patient power output and muscle satellite cell number was assessed with the Pearson product moment correlation coefficient and uni-variant linear regression performed to quantify this association. A p-value < 0.05 was considered to indicate statistical significance.
Results
The first cohort (n = 18) was examined using immunochemistry: there were seven male and 11 female patients with a mean age of 73.56 years (62 to 84). The second cohort (n = 11) was examined by molecular methods: there were four male and seven female patients with a mean age of 72.34 years (68 to 79).
Identification of satellite cells by immunohistochemistry
Of the initial 18 muscle samples, 17 were found to contain viable muscle tissue by haematoxylin & eosin staining (data not shown). In the control sections where only secondary antibodies were used, no cells were detected, thus demonstrating that there was no non-specific staining of the antibody.
The variation of satellite cell number was observed within the patient population (Table I, Fig. 1). The positive staining index (PSI) of muscle satellite cells was calculated by assessing three separate areas of each individual section. The satellite cell data was normally distributed, with a mean PSI of 7.62 (95% confidence interval (CI) 6.30 to 8.94) satellite cells per sample. The mean PSI varied between patients from 3.07 to 11.35.
Table I
Satellite cell count on immunohistochemical analysis. Data were calculated and averaged from three imaged regions per muscle section/individual patient (PSI, positive staining index)
| Sample | Mean satellite cell count | Myonuclei | PSI |
|---|---|---|---|
| 1* | - | - | - |
| 2 | 5.34 | 105 | 5.09 |
| 3 | 13 | 108.34 | 11.99 |
| 4 | 9.67 | 104.67 | 9.24 |
| 5 | 8.4 | 101.67 | 8.26 |
| 6 | 12.25 | 123.34 | 9.93 |
| 7 | 9.25 | 104.5 | 8.85 |
| 8 | 8 | 82.67 | 9.68 |
| 9 | 8.67 | 104.34 | 8.31 |
| 10 | 4 | 130.34 | 3.07 |
| 11 | 10.67 | 94 | 11.35 |
| 12 | 7.34 | 104.34 | 7.04 |
| 13 | 5 | 107.67 | 4.64 |
| 14 | 11 | 98.25 | 11.20 |
| 15 | 5.67 | 136.24 | 4.16 |
| 16 | 5.67 | 100.34 | 5.65 |
| 17 | 9.5 | 135 | 7.04 |
| 18 | 10.67 | 158.67 | 6.73 |
-
* sample 1 was found to contain no viable muscle and was therefore not included
Power output
Wide variation in power output between individual patients was observed (Table II). Significant improvement (paired samples t-test) in mean power output of 19.7 W (95% CI 14.43 to 30.07; p < 0.0001), was observed between assessments at six and 26 weeks, reflecting an improvement of 27% (95% CI 0.15 to 0.38; p < 0.0001) in power-body weight ratio. Non-significant improvement was observed between measurements pre-operatively and at six weeks (p = 0.08).
Table II
Power output (qPCR, quantitative polymerase chain reaction)
| Maximal power output (W) | Power–body weight ratio (%) | ||||||||
|---|---|---|---|---|---|---|---|---|---|
| Sample* | Pre- operative | Six weeks | 26 weeks | Change from six to 26 weeks | Pre- operative | Six weeks | 26 weeks | Change from six to 26 weeks | |
| Immunohistochemistry | |||||||||
| 1 | 30 | 33 | 41 | 8 | 0.4 | 0.5 | 0.6 | 0.1 | |
| 2 | 18 | 72 | 74 | 2 | 0.2 | 1.0 | 1.0 | 0.0 | |
| 3 | 116 | 104 | 134 | 18 | 1.1 | 1.0 | 1.2 | 0.2 | |
| 4 | 33 | 69 | 103 | 24 | 0.3 | 0.7 | 1.0 | 0.3 | |
| 5 | 73 | 60 | 103 | 43 | 0.8 | 0.8 | 1.3 | 0.5 | |
| 6 | 1 | 35 | 55 | 20 | 0.0 | 0.4 | 1.0 | 0.6 | |
| 7 | 2 | 8 | 36 | 28 | 0.0 | 0.1 | 0.4 | 0.3 | |
| 8 | - | - | - | - | - | - | - | - | |
| 9 | 137 | 148 | 189 | 41 | 1.8 | 2.0 | 2.4 | 0.4 | |
| 10 | 97 | 86 | 84 | -2 | 0.6 | 0.8 | 0.7 | -0.1 | |
| 11 | 59 | 46 | 65 | 20 | 1.1 | 0.7 | 1.2 | 0.5 | |
| 12 | 38 | 70 | 72 | 2 | 0.5 | 1.1 | 1.1 | 0.0 | |
| 13 | 4 | 20 | 28 | 8 | 0.1 | 0.3 | 0.4 | 0.1 | |
| 14 | 13 | 65 | 92 | 33 | 0.2 | 0.9 | 1.2 | 0.3 | |
| 15 | 3 | 1 | 38 | 33 | 0.2 | 0.9 | 1.2 | 0.3 | |
| 16 | - | - | - | - | - | - | - | - | |
| 17 | 144 | 115 | 149 | 34 | 1.5 | 1.2 | 1.5 | 0.3 | |
| 18 | 3 | 31 | 56 | 25 | 0.0 | 0.5 | 0.7 | 0.2 | |
| Mean (se) | 48.2 (12.6) | 60.2 (10.0) | 82.4 (11.2) | 21.1 (3.5) | 0.55 (0.14) | 0.81 (0.11) | 1.06 (0.12) | 0.25 (0.05) | |
| q-PCR | |||||||||
| 20 | 39 | 66 | 135 | 69 | 0.3 | 0.6 | 1.1 | 0.5 | |
| 21 | 10 | 37 | 53 | 15 | 0.2 | 0.7 | 0.9 | 0.2 | |
| 22 | 72 | 66 | 121 | 55 | 0.7 | 0.6 | 1.1 | 0.5 | |
| 23 | 14 | 33 | 58 | 25 | 0.2 | 0.4 | 0.8 | 0.4 | |
| 24 | 19 | 23 | 43 | 20 | 0.3 | 0.3 | 0.6 | 0.3 | |
| 25 | 30 | 37 | 49 | 12 | 0.3 | 0.4 | 0.6 | 0.2 | |
| 26 | 14 | 17 | 38 | 21 | 0.3 | 0.3 | 0.6 | 0.3 | |
| 27 | 44 | 83 | 107 | 24 | 0.5 | 1 | 1.2 | 0.2 | |
| 28 | 0 | 18 | 21 | 3 | 0 | 0.4 | 0.4 | 0 | |
| 29 | 1 | 6 | 57 | 51 | 0 | 0.1 | 0.6 | 0.5 | |
| 30 | 0 | 7 | 14 | 7 | 0 | 0.1 | 0.2 | 0.1 | |
| Mean (se) | 22.1 (6.76) | 35.7 (7.8) | 63.3 (12.1) | 27.5 (6.4) | 0.26 (0.07) | 0.45 (0.08) | 0.74 (0.9) | 0.29 (0.05) | |
-
* patients 8 and 16 were excluded from the power analysis due to medical complications following surgery that prohibited provision of this data. Patient 19 was the control specimen, and is therefore not represented in the table
Relationship between satellite cell content and power output
A strong correlation was noted between the satellite cell PSI and improvement in patient power output both in terms of maximal power output (r = 0.57, p = 0.023) and power-body weight ratio (r = 0.64, p = 0.008) (Fig. 2). Uni-variant regression (R2) demonstrated that 27% of the variation in improved maximal power output could be attributed to the variation in the number of underlying satellite cells. Furthermore, 37% of the variation could be attributed to the satellite cell number (PSI) when power output was scaled for bodyweight. This compares with the relationship of post-operative change in power output with patient age (7%), and with pre-operative power output (3.5%).
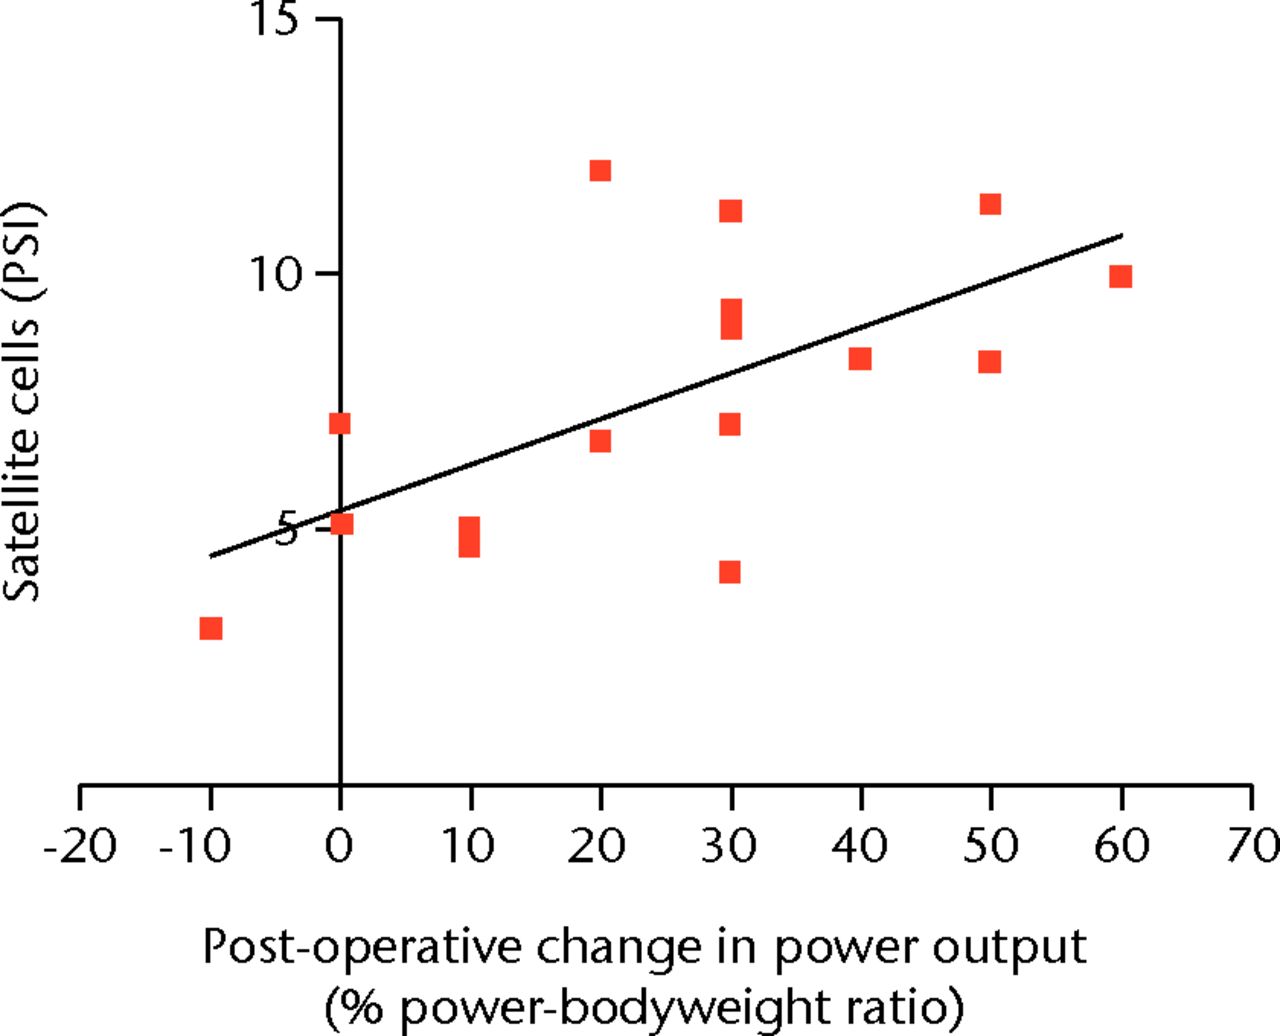
Fig. 2
Scatter graph showing the positive staining index (PSI) of satellite cells and post-operative change in power output in the cohort examined with immunohistochemistry.
Patient satellite cell profile by quantitative PCR
Despite identifying satellite cells by immunofluorescence, we wanted to further investigate the status of satellite cells in arthroplasty patients by measuring gene expression of Pax7 and NCAM. We included a younger healthy control patient in this experiment to act as a standard for the mRNA expression levels of these genes thus giving us some insight into the activity of the satellite cells in arthroplasty patients. Wide variation in Pax7 gene expression was found between arthroplasty patients, with 80% of the group having ≤ 50% Pax7 than the healthy control. Similarly there was a difference in the amount of activated satellite cell (NCAM) mRNA expressed in each patient; interestingly 60% of the arthroplasty group had NCAM expression equal to or higher than the control (Table III). No gene expression was recorded for sample 25 and no expression of NCAM was found in sample 30.
Table III
mRNA expression of Pax-7 and Neural Cell Adhesion Molecule (N-CAM) relative to the control sample by qualitative polymerase chain reaction (q-PCR)
| Sample | ||||||||||||
|---|---|---|---|---|---|---|---|---|---|---|---|---|
| Control (19) | 20 | 21 | 22 | 23 | 24 | 25 | 26 | 27 | 28 | 29 | 30 | |
| N-CAM | 1 | 1.81 | 0.91 | 2.22 | 0.69 | 0.50 | 0.00 | 1.25 | 0.87 | 0.00 | 0.95 | 0.00 |
| Pax-7 | 1 | 0.47 | 0.32 | 1.45 | 0.76 | 0.47 | 0.00 | 0.22 | 0.61 | 0.14 | 0.26 | 0.16 |
Power output
Again wide variation in power output between individual patients in this q-PCR cohort was observed (Table II). Significant improvement in mean power output of 27.5 W (95% CI 13.2 to 41.9; p = 0.002) was observed between the six- and 26-week assessments. This reflected a mean improvement of 29% (95% CI 20 to 40; p < 0.0001) in power-bodyweight ratio, the same percentage improvement as the immunohistochemical cohort.
Relationship between satellite cell content and power output
Strong correlation was observed between the expression of the generic satellite cell marker Pax-7 and both the change in maximal lower limb power output (r = 0.58, p = 0.06), and power-body weight ratio (r = 0.79, p = 0.004) (Fig. 3). Particularly strong correlation was observed between the relative expression of activated satellite cell marker (NCAM) and the both the change in the patients maximal power output (r = 0.83, p = 0.002) and power-bodyweight ratio (r = 0.84, p = 0.001) (Fig. 3).
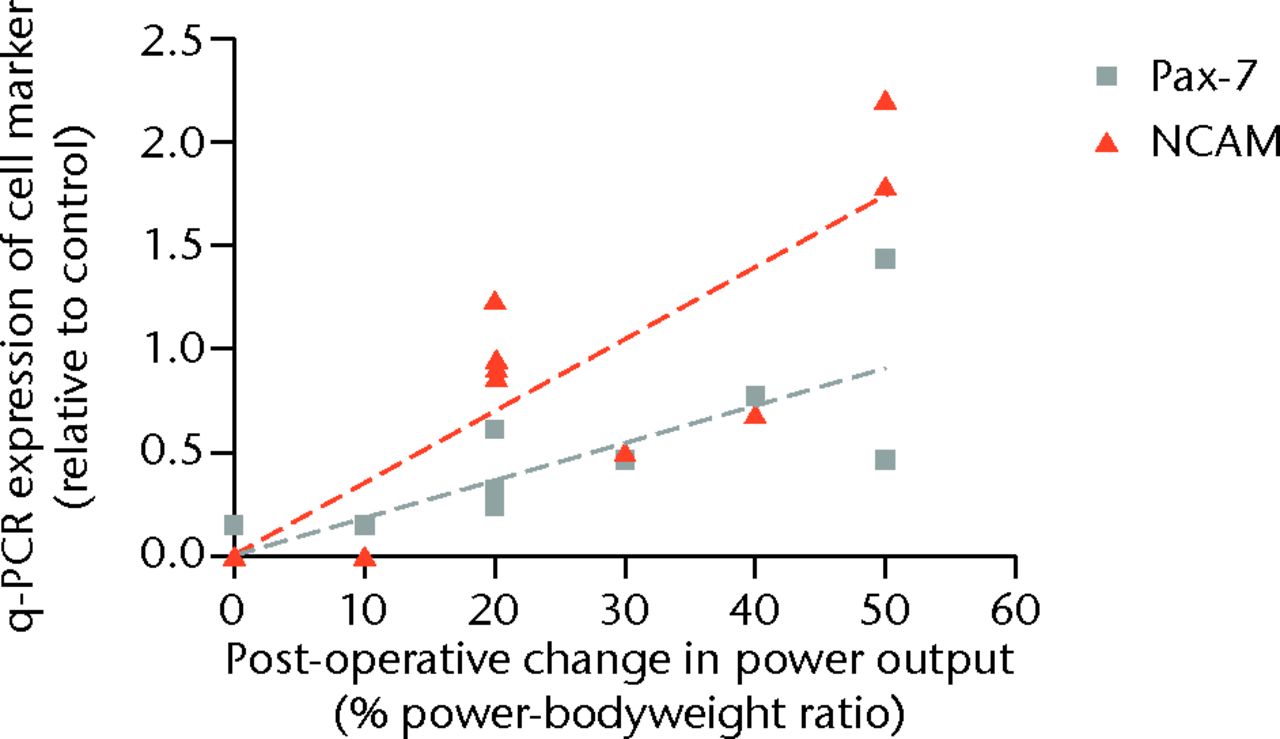
Fig. 3
Scatter graph showing the satellite cell volume by expression of cell marker and post-operative change in power output in the cohort examined with quantitative polymerase chain reaction (q-PCR) (NCAM, Neural Cell Adhesion Molecule).
Uni-variant regression demonstrated 26% of the variation in improved maximal power output could be attributed to the variation in the expression of the Pax-7 gene in the muscle samples, which increased to 58% when scaled for power-bodyweight ratio. Separately, 65% of the improvement in maximal power could be attributed to the variation in the expression of the NCAM gene in the muscle samples, 67% when scaled for power-bodyweight ratio.
Discussion
This is the first study to assess the influence of the muscle satellite cell on a patient’s physical recovery following TKR. There are three notable findings of this analysis. First, that variation in satellite cell content was found among the patient samples. Secondly, it was found that the intrinsic cell number in the patient’s quadriceps muscle accounted for much of the variance in physical performance post-operatively. Thirdly, that a stronger correlation with power output was observed with the marker of activated cells (NCAM) than with the generic satellite cell marker (Pax-7).
The immunofluorescence staining demonstrated that the number of satellite cells accounted for a third of the change in power output post-operatively, explaining around ten times more of the variance in post-operative power output compared with the patient’s pre-operative ability, which is commonly perceived to be a relevant factor.4-6 This association between satellite cells and post-operative recovery of muscle power was confirmed in the separate cohort of 11 patients, analysed with quantitative-PCR, which assessed the mRNA expression of satellite cell markers. This is the first example of such a technique being employed to measure Pax7 and NCAM in human samples. The vast majority of muscle satellite cell research has been conducted in murine models, with only a handful of authors conducting human studies. Boldrin, Muntoni and Morgan25 commented upon equivocal and sometimes contradictory reports on numbers of satellite cells in human muscle sections. However, q-PCR addresses this issue by quantifying the genetic material present in the whole sample as opposed to imaging markers on sections. An additional benefit of this analysis is that both the generic marker (Pax7) and activated cell marker (NCAM) could be assessed at the same time.
The expression of the generic marker was able to explain around 50% of the variation of the change in post-operative power output, while the activated cell marker was found to account for two thirds of the change. Two samples did not express cell markers in the qPCR experiment, which is probably as a result of tissue degradation. The time taken from muscle biopsy in theatre to immersing the sample in liquid nitrogen in the theatre anteroom was generally less than one minute, but in these cases the time was notably longer, at around five minutes. It may be that this time frame is crucial for subsequent RNA expression.
Previous large studies have shown a relationship between muscle power and post-operative function.6,7 It has been demonstrated that muscle power correlates more strongly than muscle strength to physical function, as power involves both force production and contraction velocity, which better reflects daily tasks that are force and speed dependant.26-28 Improvement in muscle power output has been reported at six months after TKR,5 and the current study supports this, also demonstrating an improved mean muscle power between assessments. Magnitude of power output is inherently associated with the individual’s underlying muscle mass, as every muscle fibre can be thought of as an independent force generating unit.11 For this reason, measurement of the improvement in power was assessed both in terms of absolute power and ratio of power relative to bodyweight. The power to bodyweight figure takes into account the general size of the individual, and is therefore the more relevant of the two measures for assessing change expressed in the population.
Pain (attributable to OA) is the prime indication for undergoing arthroplasty of the knee, and reduction of this pain the major goal of surgery. It is likely that high pre-operative pain level prevents accurate measurement of power output at this time, through limitation of the patients’ ability to generate force by pain inhibition pathways. Patients typically reported much alleviation of pain by the time of the six-week review, and all individuals were all able to mobilise at this stage without the use of the aids required in the early post-operative phase. It is thus consistent that the change in power output between six and 26 weeks was the correlated with the underlying cell content.
Mizner et al10 reported a reduction of quadriceps strength in the first three to four weeks post-operatively compared with pre-operative levels in a small TKR cohort. They suggested that a combination of muscle atrophy and failure of voluntary muscle activation explained 85% of the loss of quadriceps strength, but that the failure of activation was the dominant factor, explaining twice as much of the variance as the muscle atrophy. This failure of neuromuscular activation in the early post-operative phase is an attractive explanation of the poor levels of quadriceps strength and power reported in the first month post-operatively, however this does not explain prolonged power and strength deficits.9,29 Krishnan and Williams30 investigated chronic weakness following ACL reconstruction and found that this was not associated with failure of voluntary activation, instead peripheral changes in the muscle relating perhaps to chronic atrophy accounted for the prolonged weakness. No correlation was found in the present study between satellite cell number and power output at the six-week assessment (broadly around the same time point as the Mizner study10). It is possible that neuromuscular function deficits were important in the immediate post-operative period, whereas regenerative potential and satellite cell content may be relevant in the medium to longer term.
This is the first study to report the variation in the individuals’ satellite cell numbers in an osteoarthritic population, which was found to be similar to that in the wider population.16-18 The process of osteoarthritis is not known to affect the number of individual satellite cells. However, Charifi et al19 have demonstrated a preservation of the satellite cell pool in elderly subjects that engaged in regular exercise and as patients with osteoarthritis are likely to exercise less, they may have less well preserved satellite cell pools. This may then limit muscle regeneration post-operatively, and subsequently physical function.
In conclusion, pre-operative lower limb power (and thus patient function) was found to be less predictive of physical muscle power recovery post-TKR than the number of satellite cells within the quadriceps muscle. Ten times the variation of change in power output post-operatively was linked to the underlying number of muscle satellite cells in the individual compared with a measure of pre-operative power output. It was further found that the expression of the marker of the satellite cells that were activated, was even more strongly correlated with the change in post-operative lower limb power output, and explains around two thirds of the variation in change in post-operative power output.
1 Spangenburg E , BoothF. Invited editorial on “Myogenic satellite cells: physiology to molecular biology”. J Appl Physiol2001;91:533. Google Scholar
2 Greene KA , SchurmanJR. Quadriceps muscle function in primary total knee arthroplasty. J Arthroplasty2008;23(Suppl):15–19.CrossrefPubMed Google Scholar
3 Hamilton D , HendersonGR, GastonP, et al.Comparative outcomes of total hip and knee arthroplasty: a prospective cohort study. Postgrad Med J2012;88:627–663.CrossrefPubMed Google Scholar
4 Heck DA , RobinsonRL, PartridgeCM, LubitzRM, FreundDA. Patient outcomes after knee replacement. Clin Orthop Relat Res1998;356:93–110.CrossrefPubMed Google Scholar
5 Lamb SE , FrostH. Recovery of mobility after knee arthroplasty: expected rates and influencing factors. J Arthroplasty2003;18:575–582.CrossrefPubMed Google Scholar
6 Franklin PD , LiW, AyersDC. The Chitranjan Ranawat Award: functional outcome after total knee replacement varies with patient attributes. Clin Orthop Relat Res2008;466:2597–2604.CrossrefPubMed Google Scholar
7 Lingard EA , KatzJN, WrightEA, SledgeCB. ; Kinemax Outcomes Group. Predicting the outcome of total knee arthroplasty. J Bone Joint Surg [Am]2004;86-A:2179–2186. Google Scholar
8 Mizner RL , PettersonSC, StevensJE, AxeMJ, Snyder-MacklerL. Preoperative strength predicts functional ability one year after total knee arthroplasty. J Rheumatol2005;32:1533–1539. Google Scholar
9 Silva M , ShepherdEF, JacksonWO, et al.Knee strength after total knee arthroplasty. J Arthroplasty2003;18:605–611. Google Scholar
10 Mizner RL , PettersonSC, StevensJE, VandenborneK, Snyder-MacklerL. Early quadriceps strength loss after total knee arthroplasty: the contribution of muscle atrophy and failure of voluntary muscle activation. J Bone Joint Surg [Am]2005;87-A:1047–1053. Google Scholar
11 Studitsky AN . Free auto- and homografts of muscle tissue in experiments on animals. Ann N Y Acad Sci1964;120:789–801.CrossrefPubMed Google Scholar
12 Hawke TJ , GarryDJ. Myogenic satellite cells: physiology to molecular biology. J Appl Physiol2001;91:534–551.CrossrefPubMed Google Scholar
13 Jones DA, Round JM. Skeletal muscle in health and disease: a textbook of muscle physiology. Manchester: Manchester University Press, 1990. Google Scholar
14 Mauro A . Satellite cell of skeletal muscle fibers. J Biophys Biochem Cytol1961;9:493–495.CrossrefPubMed Google Scholar
15 Zammit PS , PartridgeTA, Yablonka-ReuveniZ. The skeletal muscle satellite cell: the stem cell that came in from the cold. J Histochem Cytochem2006;54:1177–1191.CrossrefPubMed Google Scholar
16 Renault V , ThornellLE, ErikssonPO, Butler-BrowneG, MoulyV. Regenerative potential of human skeletal muscle during aging. Aging Cell2002;1:132–139.CrossrefPubMed Google Scholar
17 Kadi F , CharifiN, DenisC, LexellJ. Satellite cells and myonuclei in young and elderly women and men. Muscle Nerve2004;29:120–127.CrossrefPubMed Google Scholar
18 Verdijk LB , KoopmanR, SchaartG, et al.Satellite cell content is specifically reduced in type II skeletal muscle fibers in the elderly. Am J Physiol Endocrinol Metab2007;292:E151–E157.CrossrefPubMed Google Scholar
19 Charifi N , KadiF, FéassonL, DenisC. Effects of endurance training on satellite cell frequency in skeletal muscle of old men. Muscle Nerve2003;28:87–92.CrossrefPubMed Google Scholar
20 Mackey AL , EsmarckB, KadiF, et al.Enhanced satellite cell proliferation with resistance training in elderly men and women. Scand J Med Sci Sports2007;17:34–42.CrossrefPubMed Google Scholar
21 Kadi F , PonsotE. The biology of satellite cells and telomeres in human skeletal muscle: effects of aging and physical activity. Scand J Med Sci Sports2010;20:39–48.CrossrefPubMed Google Scholar
22 Bassey EJ , FiataroneMA, O’NeillEF, et al.Leg extensor power and functional performance in very old men and women. Clin Sci (Lond)1992;82:321–327.CrossrefPubMed Google Scholar
23 Robertson S , FrostH, DollH, O’ConnorJJ. Leg extensor power and quadriceps strength: an assessment of repeatability in patients with osteoarthritic knees. Clin Rehab1998;12:120–125.CrossrefPubMed Google Scholar
24 Barker KL , LambSE, SimpsonAH. Functional recovery in patients with nonunion treated with the Ilizarov technique. J Bone Joint Surg [Br]2004;86-B:81–85.PubMed Google Scholar
25 Boldrin L , MuntoniF, MorganJE. Are human and mouse satellite cells really the same?J Histochem Cytochem2010;58:941–955.CrossrefPubMed Google Scholar
26 Evans WJ . Exercise strategies should be designed to increase muscle power. J Gerontol A Biol Sci Med Sci2000;55:M309–M310.CrossrefPubMed Google Scholar
27 Bassey EJ , ShortAH. A new method for measuring power output in a single leg extension: feasibility, reliability and validity. Eur J Appl Physiol1990;60:385–390.CrossrefPubMed Google Scholar
28 Bean JF , LeveilleSG, KielyDK, et al.A comparison of leg power and leg strength within the InCHIANTI study: which influences mobility more?J Gerontol A Biol Sci Med Sci2003;58:728–733.CrossrefPubMed Google Scholar
29 Huang CH , ChengCK, LeeYT, LeeKS. Muscle strength after successful total knee replacement: a 6- to 13-year followup. Clin Orthop Relat Res1996;328:147–154.CrossrefPubMed Google Scholar
30 Krishnan C , WilliamsN. Factors explaining chronic knee extensor strength deficits after ACL reconstruction. J Orthop Res2011;29:633–640.CrossrefPubMed Google Scholar
Funding statement:
At the time of this work DFH received a PhD studentship form the Medical Research Council and Stryker UK. These bodies had no role in the design; collection, analysis or interpretation of data; or in the writing of the article and decision to submit for publication
Author contributions:
D. F. Hamilton: Study design, Data collection, Data analysis, Statistical analysis, Writing manuscript
J. A. McLeish: Study design, Data analysis, Revised manuscript for intellectual content, Manuscript approval
P. Gaston: Performed surgeries, Revised manuscript for intellectual content, Manuscript approval
A. H. R. W. Simpson: Study design, Revised manuscript for intellectual content, Manuscript approval
ICMJE Conflict of Interest:
None declared
©2013 The British Editorial Society of Bone & Joint Surgery. This is an open-access article distributed under the terms of the Creative Commons Attributions licence, which permits unrestricted use, distribution, and reproduction in any medium, but not for commercial gain, provided the original author and source are credited.
