


Abstract
Objectives
In order to ensure safety of the cell-based therapy for bone regeneration, we examined in vivo biodistribution of locally or systemically transplanted osteoblast-like cells generated from bone marrow (BM) derived mononuclear cells.
Methods
BM cells obtained from a total of 13 Sprague-Dawley (SD) green fluorescent protein transgenic (GFP-Tg) rats were culture-expanded in an osteogenic differentiation medium for three weeks. Osteoblast-like cells were then locally transplanted with collagen scaffolds to the rat model of segmental bone defect. Donor cells were also intravenously infused to the normal Sprague-Dawley (SD) rats for systemic biodistribution. The flow cytometric and histological analyses were performed for cellular tracking after transplantation.
Results
Locally transplanted donor cells remained within the vicinity of the transplantation site without migrating to other organs. Systemically administered large amounts of osteoblast-like cells were cleared from various organ tissues within three days of transplantation and did not show any adverse effects in the transplanted rats.
Conclusions
We demonstrated a precise assessment of donor cell biodistribution that further augments prospective utility of regenerative cell therapy.
Cite this article: Bone Joint Res 2014;3:76–81.
Article focus
To ensure safety of the cell-based therapy for bone regeneration, we examined biodistribution of locally or systemically transplanted osteoblast-like cells.
Key messages
Locally transplanted osteoblast-like cells resided within the transplanted site and were not detected in other organs at two weeks after transplantation.
Intravenously infused cells were cleared from various organ tissues within three days of transplantation, without showing any adverse effects in the transplanted rats.
Strengths and limitations
Strengh: This is the first validation of biodistribution of locally or systemically transplanted osteoblast-like cells. We clearly demonstrated the safety of cell therapies using culture-expanded osteoblast-like cells.
Limitation: Transplanted cells were heterogeneous and the cellular localisation has not been analysed in vascular or other organs including heart, pancreas, and intestine.
Introduction
Distraction osteogenesis (DO) is a well-established therapeutic technique used for limb lengthening and bone regeneration with an external device following osteotomy.1-5 Long-term treatment, however, is essential to extend the bone by DO, which may lead to a risk of adjacent joint contractures and pin track infection. In order to minimise these DO-related complications, several trials have been carried out such as ultrasonic stimulation,6,7 electronic stimulation,8 hyperbaric oxygen exposure,9 transplantation of fresh bone marrow (BM) cells or administration of growth hormone or cytokines to shorten the treatment period and enhance osteogenesis in DO.10-13 We have developed a novel DO technique to shorten the consolidation period by performing transplantation of culture-expanded osteoblast-like cells together with platelet rich plasma (PRP), thrombin and calcium.14-16 Our cell therapy accelerated bone regeneration and decreased the associated adverse effects, which indicated the utility of combining osteoblast-like cells and biomaterials for DO.
Systemic adverse effects regarding BM cell transplantation still remain controversial. Several studies have reported the safety of transplanting both fresh and cultured BM cells,17,18 On the other hand, some investigators have found that autologous transplantation of BM cells developed unexpected adverse effects, including unfavourable angiogenesis and even death.19,20 It is important to assess the systemic biodistribution of transplanted BM cells in the recipient to ensure secure use of BM cells in regeneration medicine.
In this study, local and systemic biodistribution of transplanted osteoblast-like cells was analysed in a rat model. For local biodistribution of transplanted cells, we used a segmental bone defect model instead of a DO model to simplify the experimental procedure. Donor BM cells were harvested from green fluorescent protein (GFP)-transgenic (GFP-Tg) rats in order to trace the transplanted cells in the recipient rat. Flow cytometric and histological analyses were performed to assess the biodistribution of donor cells after transplantation.
Materials and Methods
Cell cultures for rat bone marrow cells
A total of 31 Sprague-Dawley (SD) rats and 17 GFP-Tg rats were purchased (Japan SLC, Inc. Shizuoka, Japan). The experimental procedures were approved by the Animal Experimentation and Ethics Committee of the Nagoya University School of Medicine, and all animal experiments were conducted following the guidelines of the committee for the care and use of experimental animals.
The standard culture medium for osteoblastic differentiation (OS medium) used in the current study consisted of Dulbecco’s modified Eagle’s medium (Sigma-Aldrich, St Louis, Missouri), 1.0x10⁻⁷ M Dexamethasone (Sigma-Aldrich), 10 mM Glycerol-2-phosphate disodium salt hydrate (Sigma-Aldrich), 2 uM Ascorbic acid (Wako Pure Industries, Ltd, Osaka, Japan), 100 unit/ml penicillin, 100 ug/ml streptomycin (Gibco, Grand Island, New York), 0.75 ug/ml FUNGIZONE (Gibco) and 10% heat inactivated fetal calf serum (Thermo Scientific, Waltham, Massachusetts), under 5% CO2, 37°C. Rat BM cells were obtained from the femur of eight-week-old SD-GFP Tg rats (n = 13). The ends of the femur were cut and the marrow was flushed out using culture medium in a 5 mL syringe (Terumo, Tokyo, Japan) with a 21-gauge needle (Terumo). Nonadherent cells were removed and adherent cells were expanded as a monolayer culture, with medium changes every two or three days. When culture dishes became near confluent, cells were dissociated with 0.025% trypsin-EDTA (Gibco) and suspended for continued passage. Cells used for transplantation were passaged three times and cultured over a three week period.
Transplantation of culture-expanded osteoblastic cells
A segmental bone defect rat model wasprepared as described previously.21 Briefly, rats were anesthetised with an intraperitoneal infusion of Nembutal (30 mg/kg to 40 mg/kg: diluted with saline solution) (Dainippon Pharmaceutical Co, Ltd, Osaka, Japan) and a mini external fixator-distractor (Nagoya Screw Manufacturing Co., Ltd, Nagoya, Japan) was secured to the rat’s right femoral bone using four threaded pins. The mid-third of the bone shaft was osteotomised. After fixation of the distraction device, a bone defect 5 mm in length was prepared by lengthening the femur and collagen sponge (Koken Co., Ltd., Tokyo Japan) containing 5 x 10⁶ of culture BM cells, which were put on the site of the bone defect (Fig. 1a). The animals were allowed to move freely in cages after recovery from anesthesia. For intravenously infusion experiments, five million osteoblast-like cells were systemically infused into the normal SD rats via puncture of the femoral vein (Fig. 1b). Infusion of PBS without osteoblast-like cells was used as a negative control. To analyse donor-cell contribution, recipient-rat tissues were periodically assessed at one and two weeks after transplantation in bone defect rats, and at two hours, one and three days after intravenous infusion.
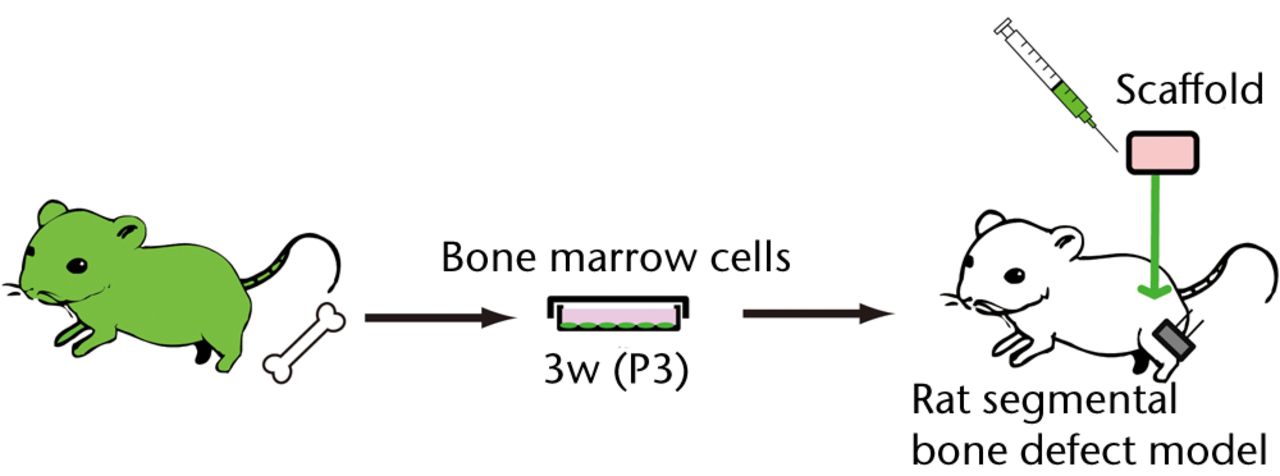

Figs. 1a - 1b
Figure 1a – Schematic diagrams of the experimental procedure of a rat segmental bone defect model. BM cells harvested from GFP-Tg rat were cultured in a medium for osteoblastic differentiation (OS medium) for three weeks. Three passaged (P3) 5 x 10⁶ cells were embedded in a collagen sponge and transplanted into bone defect rats. Figure 1b – The experimental procedure for intravenous infusion of osteoblast-like cells into the healthy SD rats. BM cells harvested from GFP-Tg rat were cultured in an OS medium for three weeks. Three passaged (P3) 5 x 10⁶ cells were systemically infused into the SD rats via femoral vein.
Flow cytometry, histological analysis and real-time polymerase chain reaction (PCR)
A total of thirty-five rats were euthanised under anesthesia with CO2, and tissue was collected at various time points (two hours, one, three, seven and 14 days) following local transplantation or systemic infusion of osteoblast-like cells. Peripheral blood (PB) was collected from the heart. Lungs, livers and brains were digested with digestion buffer, 1 mg/ml collagenase (Wako Pure Industries, Ltd, Osaka, Japan), 1 mg/ml dispase (Gibco) and DNase (Sigma-Aldrich) in PBS at 37° C for 30 minutes. These tissues and spleens were pressed between two frosted glass slides (Matsunami Glass, Osaka, Japan). After centrifugation, packed cells were suspended in a Red Blood Cell Lysing Buffer (Sigma-Aldrich) and left at room temperature for five minutes to lyse red blood cells. After washing with a cold medium, the cell suspension was passed through a 200 G mesh to remove large debris.Two-10 x 105 cells were then suspend in ice-cold Hank’s balanced salt solution (Gibco) containing 0.5% bovine serum albumin (Gibco). After washing, the cells were analysed on MACSquant (MiltenyiBiotec, BergischGladbach, Germany). Data were analysed by FlowJo software (Tree star, Inc., Ashland, Oregon).
For histological analysis, 35 rats were euthanised and tissues were fixed with 4% paraformaldehyde (PFA) (Electron Microscopy Science, Hatfield, Philadelphia) overnight at 4°C. Femora were completely decalcified in 10% ethylenediamine tetraacetic acid (pH 7.4) (Gibco) in PBS for a week at room temperature. After fixation, tissues were washed with PBS and put into 30% sucrose (Wako Pure Industries) in PBS overnight at 4°C. After removing 30% sucrose, the tissues were embedded in an OCT compound (Tissue-tek; Sakura Inc, Tokyo, Japan), and serial section was performed to a thickness of 10 um by Leica CM3050S (Leica DM IRBE, Leica Microsystems, Wetzlar, Germany). After washing with PBS, the slides were mounted with VECTASHIELD Mounting Medium with DAPI (Vector Laboratories, Burlingame, California) and nail polish. Fluorescent images of the slides were analysed on BS-9000 (KEYENCE, Osaka, Japan).
For real-time PCR, DNA was extracted from 17 rats with the QIAamp (QIAGEN) and 50 ng of DNA was used for the following assay. Real-time PCR was performed with the LightCycler 480 (Roche Diagnostics, Basel, Switzerland) according to the manufacturer’s instruction. DNA was amplified by using the following combination of primer sets: EGFP forward, 5’-CGACCACTACCAGCAGAA CA-3’ and reverse, 5’-TCTCGTTGGGGTCTTTGC-3’; GAPDH forward, 5’-TTGTGCA GTGCCAGCCTCGT-3’ and reverse, 5’-GTCACAAGAGAAGGCAGCCCTGG-3’.
PCR standards for determining copy number of GFP were used, amplicons of GAPDH cloned into the vector pGEM-Teasy (Promega Corporation, Madison, Wisconsin), and EGFP plasmid was kindly gifted from Dr. Itoh (Nagoya University). The program consisted of a denaturation step (9°C for five minutes), followed by cycles of touchdown PCR (10 seconds at 95°C, 10 seconds at 60°C and 10 seconds at 72°C) and a melting-curve step (97°C).
Statistical analysis
For data obtained from the flow cytometric analysis, the frequency of donor cells was analysed as the mean percent GFP-positive cells with the standard error of the mean (SEM). Statistical analyses were performed using GraphPad Prism (GraphPad software Inc., San Diego, California). Ap-value of less than 0.05 was considered statistically significant.
Results
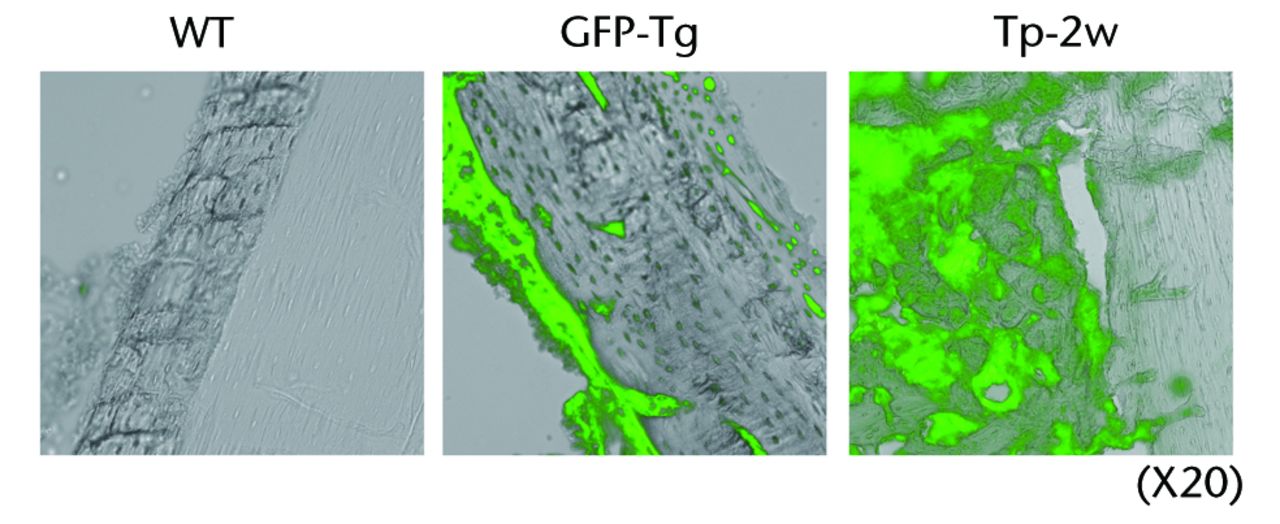
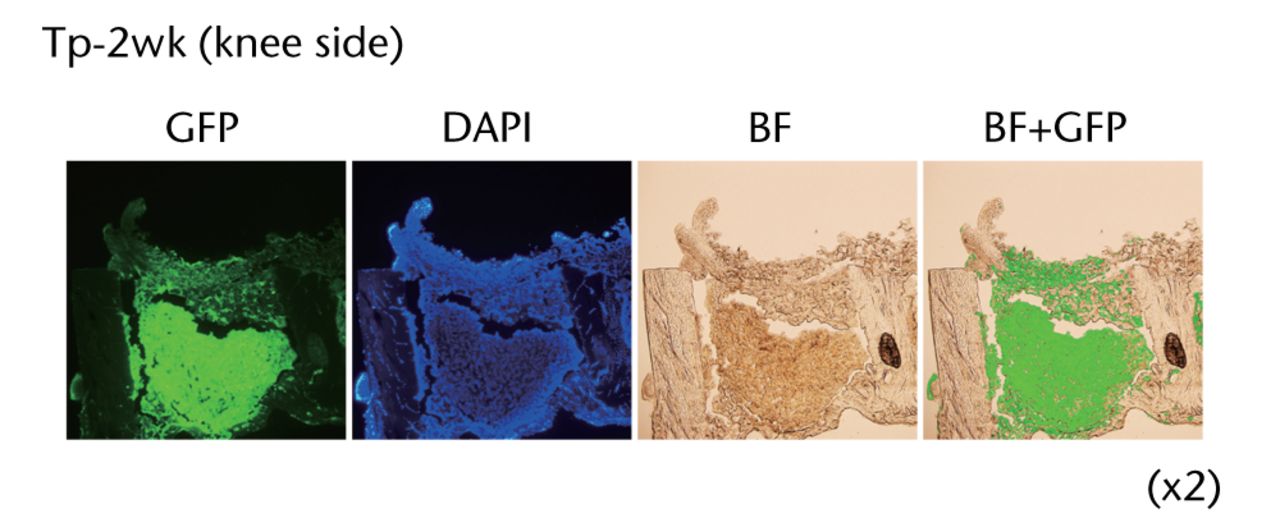
Transplanted collagen scaffolds still remained and a majority of GFP-positive osteoblast-like cells survived in the scaffolds at two weeks after donor cell transplantation (Figs 2a and 2b).
Figs. 2a - 2b
Figure 2a – Histological analyses of the femur from a rat bone defect model. Left panel indicates the wild-type rat as a negative control (n = 4), middle panel indicates the GFP-Tg rat as a positive control (n = 1), and right panel indicates the bone defect rat transplanted with osteoblast-like cells after two weeks of transplantation (Tp-2w, n = 4). Images (x 20) are merged with GFP field and bright field. Figure 2b – Low magnification images of the femur from bone defect rats transplanted with osteoblast-like cells (x2). Histological analysis of the bone defect rats was performed after two weeks of transplantation (Tp-2w). The scaffolds contain osteoblast-like cells were located on the defected site. The images on the right are merged with GFP field and bright field (BF).
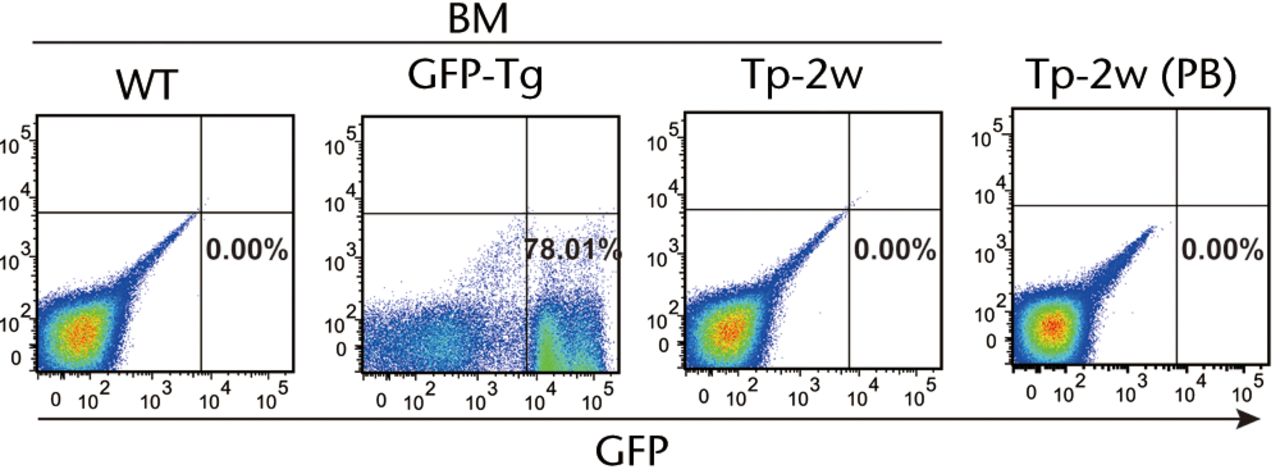
In order to analyse several cell populations, the gate of flowcytometric analysis was set at a wide area. As shown in Fig. 3a, none of GFP-positive cells was detected in the contralateral BM of the operated femur by flow cytometric analysis. Not only BM, but also other tissues including PB, lung, liver, spleen and brain did not have GFP-positive cells at one or two weeks after transplantation (Fig. 3b). Consistent with flow cytometric analysis, GFP-positive cells were not observed in lung, liver, spleen and brain by histological analysis (data not shown). In addition, there were no histological abnormalities including vascular occlusion, cell invasion or cell division of transplanted cells in all organs tested.
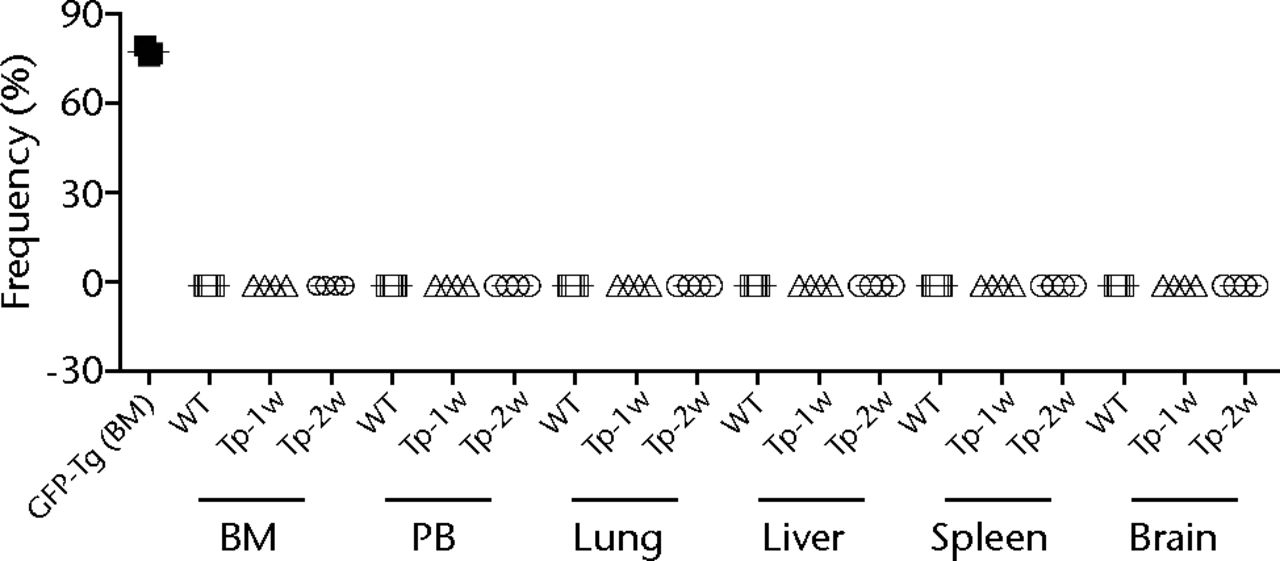
Figs. 3a - 3b
Figure 3a – Representative flow cytometric plots showing bone marrow (BM) from the wild-type (WT) rats and GFP-Tg rats (GFP-Tg), and BM and peripheral blood (PB) from bone defect rats that were transplanted with osteoblast-like cells after two weeks of transplantation (Tp-2w). Numbers shown in the figure indicate the frequency of GFP-positive cells. Figure 3b – Graph showing percentage of GFP-positive cells in BM, PB, lung, liver, spleen and brain at one and two weeks after transplantation. WT rat was used as a negative control, whereas BM of GFP-Tg rat was used as a positive control (n = 3 or 4 each). Horizontal lines represent means.
Histological examinations of various organs demonstrated that none of GFP-positive osteoblast-like cells were detected in BM, PB, lung, liver, spleen and brain both at one and two weeks after intravenous infusion (Fig. 4, and data not shown). By the clearance kinetic experiments, we detected approximately 0.03% and 0.004% of GFP-positive cells in the lung at two hours and one day after intravenous infusion, respectively. However, these cells were cleared after three days of intravenous infusion (Fig. 5a). GFP-positive cells were rarely detected in liver (0.001%), PB (0.001%), BM (< 0.001%) and spleen (< 0.001%) at two hours after infusion. These cells were no longer detectable after one day of intravenous infusion (Fig. 5b). It should be noted that no GFP-positive cells were detected in the brain. Histological examinations of the lung and liver revealed that only a few GFP-positive cells were seen in the lung at two hours after intravenous infusion, but they completely disappeared at three days after infusion (Fig. 5c). No vascular occlusion was detected in lung, liver, spleen and brain for three days post-infusion (data not shown). Quantitative real-time PCR analysis demonstrated that the GFP gene was not detected in any tissue of a recipient rat, including an ovary (Fig. 5d). Because qPCR assays require more than 100 cells to detect the target gene, this result indicates that GFP-positive cells residing in several tissues at two hours after transplantation were at less than 100.
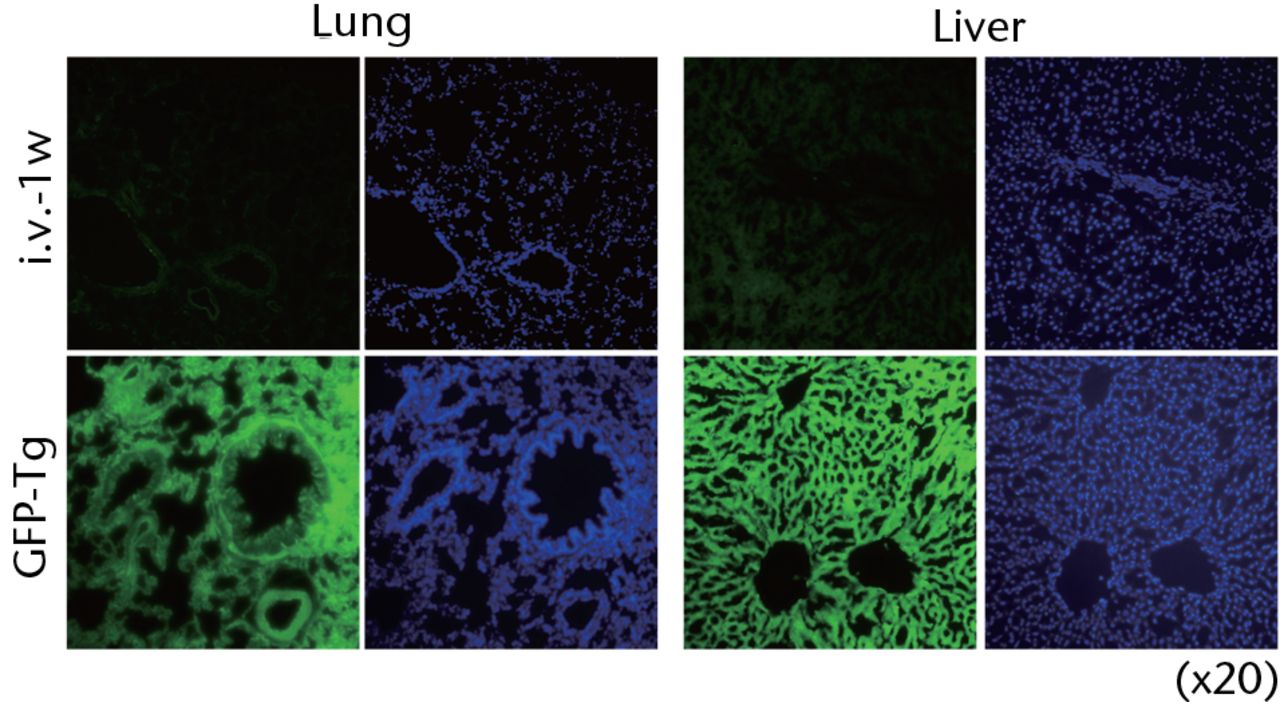
Fig. 4
Representative macroscopic images of the GFP expression in the lung (left) and liver (right) from the recipient rats at one week after intravenous infusion (i.v.-1w) of GFP-positive cells (upper panel), and from the GFP-Tg rats as a positive control (lower panel). Nuclei were stained with DAPI.
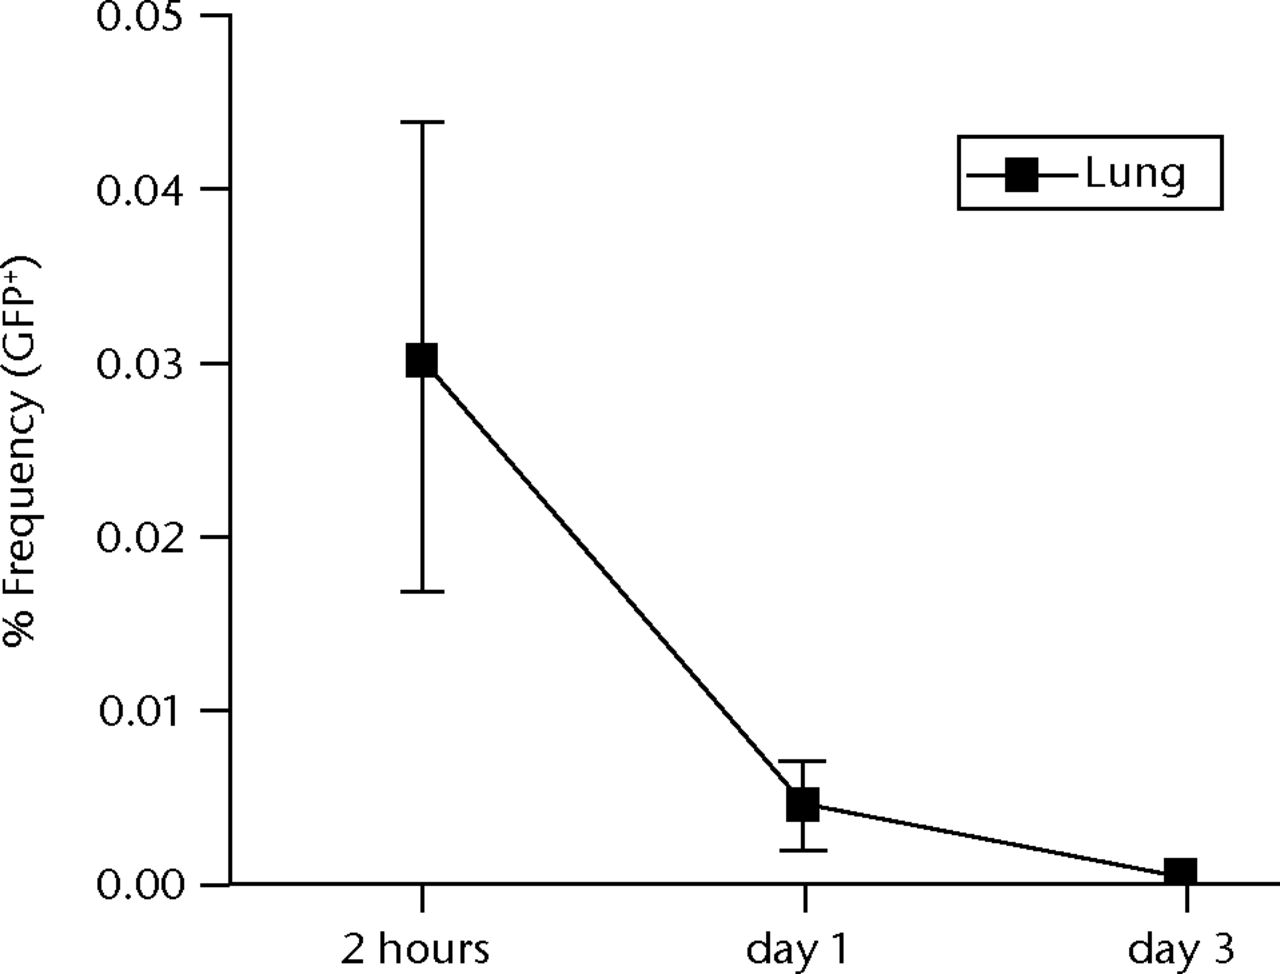
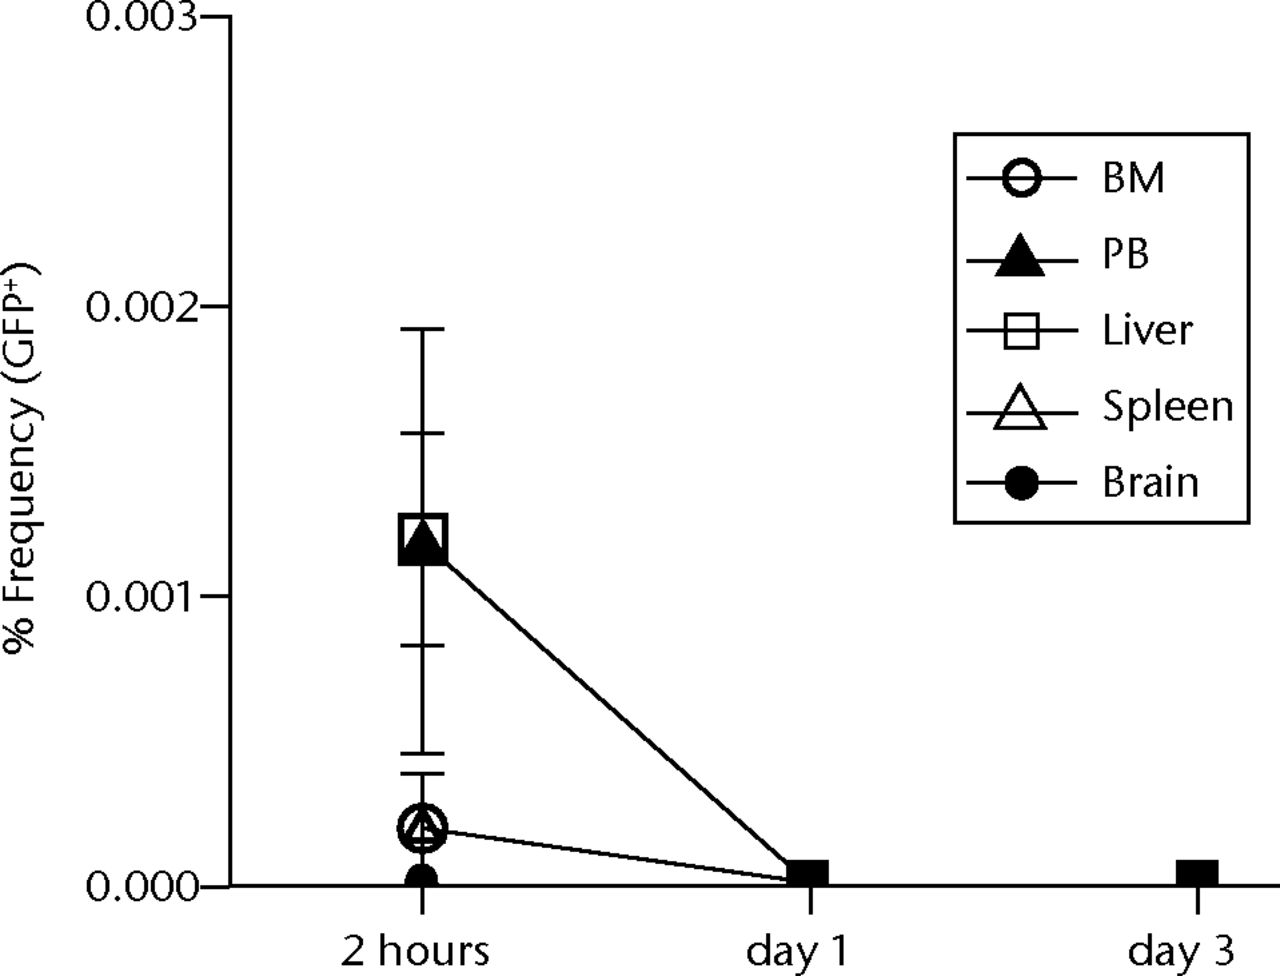
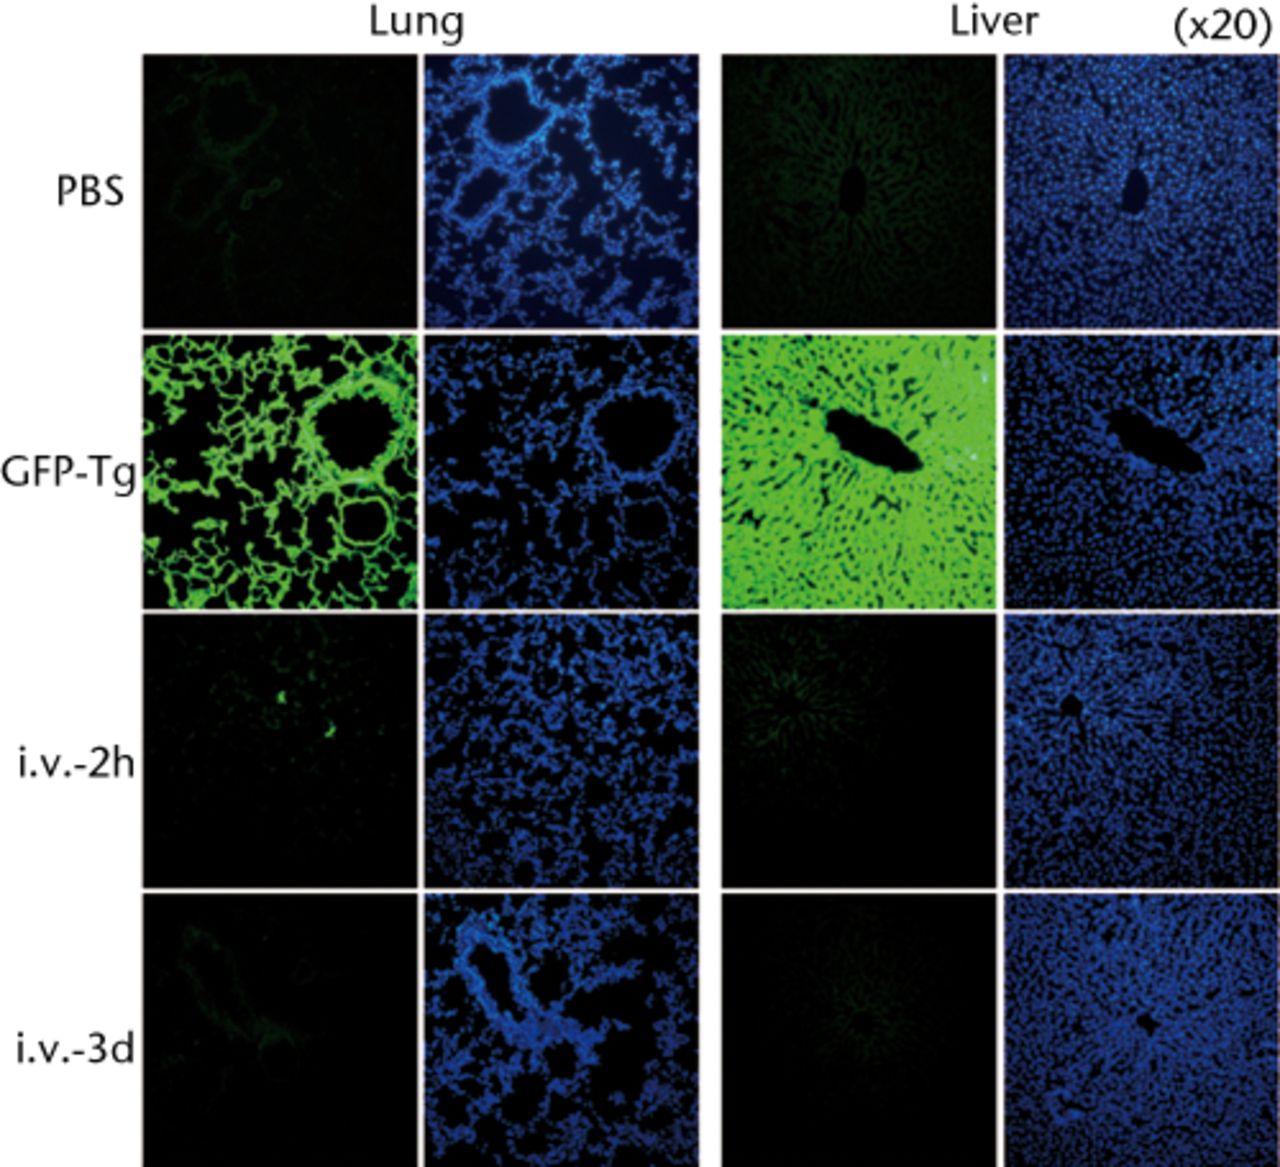
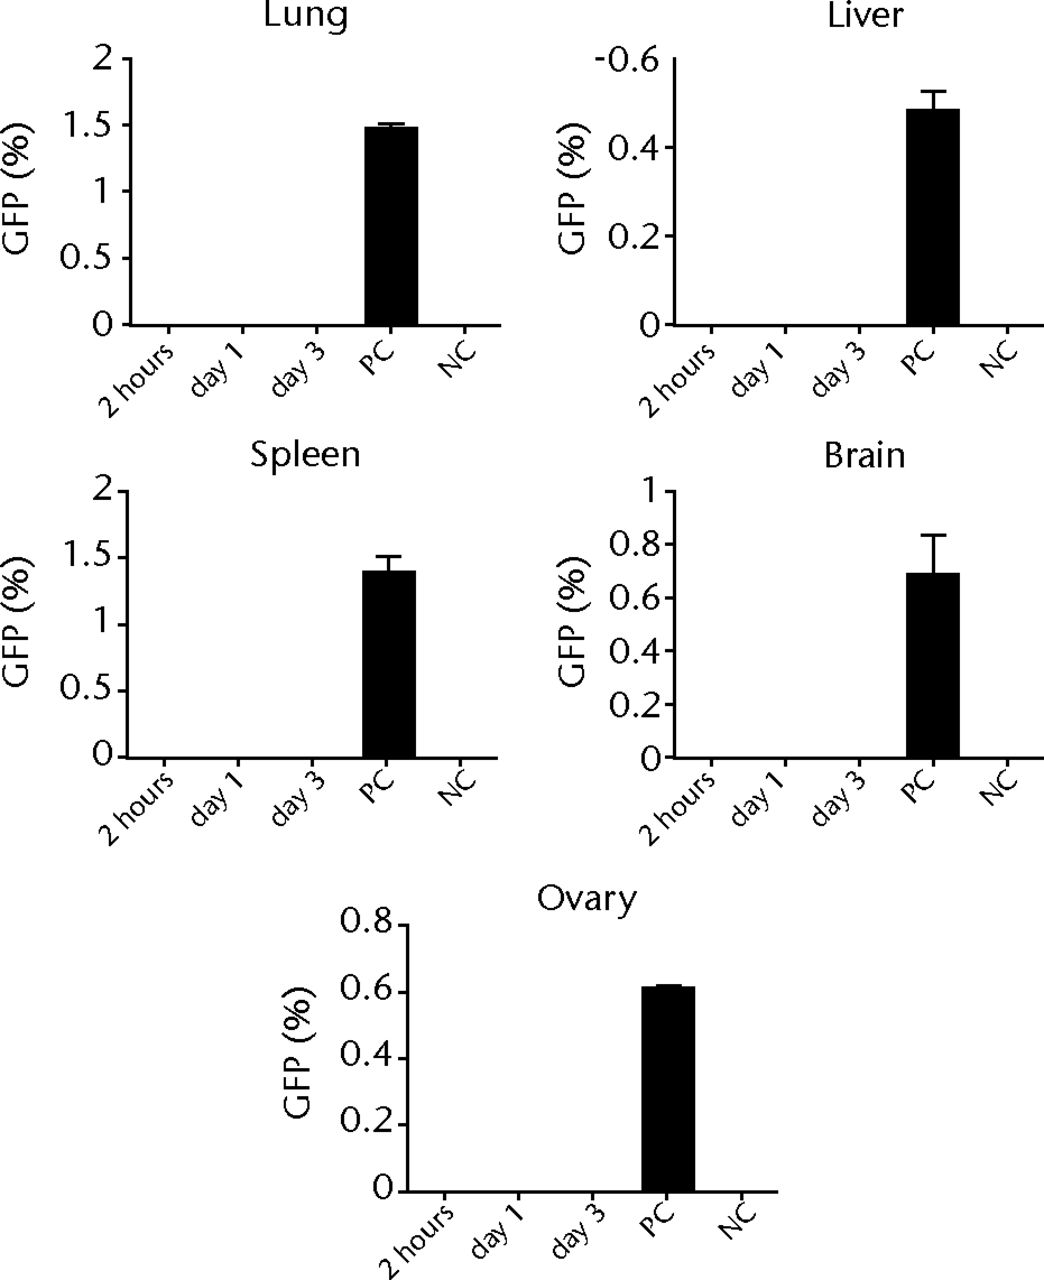
Figs. 5a - 5d
Figure 5a – Graph showing percentage of GFP-positive cells in lung at two hours, one and three days after intravenous infusion (n = 4 or 5 each). Values are presented as standard error of the mean (SEM). Figure 5b – Graph showing percentage of GFP-positive cells in BM, PB, liver, spleen and brain at two hours, one and three days after intravenous infusion (n = 4 or 5 each). Values are presented as standard error of the mean (SEM). Figure 5c – Representative macroscopic images of the GFP expression in lung (left) and liver (right) at two hours (i.v.-2h) and three days (i.v.-3d) after intravenous infusion. PBS without osteoblast-like cells was used as a negative control, whereas GFP-Tg rat was used as a positive control. Nuclei were stained with DAPI. Figure 5d – Bar graph showing quantification of the GFP gene by real-time PCR. Copy numbers of GFP were normal to that of GAPDH. PBS was used as a negative control (NC), whereas GFP-Tg rat was used as a positive control (PC). Values are presented as standard error of the mean (SEM).
Discussion
This study presents evidence for the clinical safety of cultured osteoblast-like cells derived from BM cells in regenerative medicine. To our knowledge, this is the first report to show the systemic biodistribution of transplanted osteoblast-like cells in the recipient using the rat model of a segmental bone defect. We found that the majority of GFP-positive cells were localised at the transplanted site, without migrating to PB or other tissues. Transplanted cells survived in the transplanted site because the healing process occurs in the bone defect area rich in cytokines and growth factors, where the transplanted collagen scaffold is located. In addition, the atelocollagen sponge has a structure which facilitates the ready supply of nutrients to the cells. Unfortunately, we did not demonstrate the final fate of these transplanted cells; however, based on the in vitro data, we assume they differentiate into mature osteoblasts. Transplanted cells, which were differentiated into osteoblast-like cells for three weeks, might be suitable to reside in the bone, although the atelocollagen scaffold could play a role in preventing diffusion of embedded cells. Even though we did not quantify the viability of osteoblasts derived from transplanted cells, we presume that these differentiated, rather than un-differentiated cells, have more capability to differentiate into the osteoblasts and calcify.
We demonstrated that a small number of transplanted GFP-positive cells was detected in the lung, liver, PB, BM and spleen at two hours after intravenous injection. Previous reports have shown that cultured BM cells infused intravenously were particularly retained in reticular tissues.22,23 Contrary to these reports, Eggenhofer et al24 demonstrated the short-term survival of infused cultured BM cells and a lack of distribution of viable BM cells beyond the lung. We showed that transplanted osteoblast-like cells were completely cleared within three days after systemic infusion, even in the reticular tissues. We assume that undifferentiated mesenchymal stem cells (MSCs) used in previous studies tend to move to other organs, rather than differentiated cells. Since the differentiated cells were transplanted, the number of MSCs contained in transplanted cells was less than others and this might provide favourable results. Notably, no GFP- positive cells were detected in genital tissues such as those within the ovary, indicating that transplanted osteoblast-like cells may not affect offspring. Our results suggest the safety of transplantation of osteoblast-like cells in bone regenerative medicine.
There are several limitations to our study. First, osteoblast-like cells obtained from BM after three weeks of cultivation are heterogeneous, without sorting MSCs. Second, we did not analyse the cell localisation in the vascular or other organs including the heart, pancreas and intestine. Further studies for characterisation of transplanted cells and detailed examinations of other important organs are needed to prove the safety of cell therapies using cultured BM cells.
In the current study, we showed that osteoblast-like cells locally transplanted into bone defects were not detected in other tissues at two weeks after transplantation and that systemically infused osteoblast-like cells mainly resided in the lung at one day of intravenous infusion, but were cleared within three days of infusion. Consistent with other previous reports concerning cultured BM cell transplantation studies, donor cells do not migrate to other tissues or organs and do not show any negative effects to the recipients, although there are some differences in duration of clearance.18,25,26
1 Ilizarov GA . Clinical application of the tension-stress effect for limb lengthening. Clin Orthop Relat Res1990;250:8–26.PubMed Google Scholar
2 Dal Monte A , DonzelliO. Tibial lengthening according to Ilizarov in congenital hypoplasia of the leg. J Pediatr Orthop1987;7:135–138.CrossrefPubMed Google Scholar
3 Saleh M , BurtonM. Leg lengthening: patient selection and management in achondroplasia. Orthop Clin North Am1991;22:589–599.PubMed Google Scholar
4 García-Cimbrelo E , OlsenB, Ruiz-YagüeM, Fernandez-BaílloN, Munuera-MartínezL. Ilizarov technique: results and difficulties. Clin Orthop Relat Res1992;283:116–123. Google Scholar
5 Paley D . The correction of complex foot deformities using Ilizarov's distraction osteotomies. Clin Orthop Relat Res1993;293:97–111.PubMed Google Scholar
6 Sato W , MatsushitaT, NakamuraK. Acceleration of increase in bone mineral content by low-intensity ultrasound energy in leg lengthening. J Ultrasound Med1999;18:699–702.CrossrefPubMed Google Scholar
7 Yang KH , ParviziJ, WangSJ, et al.Exposure to low-intensity ultrasound increases aggrecan gene expression in a rat femur fracture model. J Orthop Res1996;14:802–809.CrossrefPubMed Google Scholar
8 Pepper JR , HerbertMA, AndersonJR, BobechkoWP. Effect of capacitive coupled electrical stimulation on regenerate bone. J Orthop Res1996;14:296–302.CrossrefPubMed Google Scholar
9 Kitakoji T , TakashiS, OnoY, et al.Effect of hyperbaric oxygenation treatment on lengthened callus. Undersea Hyperb Med1999;26:165–168.PubMed Google Scholar
10 Tsubota S , TsuchiyaH, ShinokawaY, TomitaK, MinatoH. Transplantation of osteoblast-like cells to the distracted callus in rabbits. J Bone Joint Surg [Br]1999;81-B:125–129.CrossrefPubMed Google Scholar
11 Hagino T , HamadaY. Accelerating bone formation and earlier healing after using demineralized bone matrix for limb lengthening in rabbits. J Orthop Res1999;17:232–237.CrossrefPubMed Google Scholar
12 Hamanishi C , YoshiiT, TotaniY, TanakaS. Bone mineral density of lengthened rabbit tibia is enhanced by transplantation of fresh autologous bone marrow cells. An experimental study using dual X-ray absorptiometry. Clin Orthop Relat Res1994;303:250–255.PubMed Google Scholar
13 Richards M , HuibregtseBA, CaplanAI, GouletJA, GoldsteinSA. Marrow-derived progenitor cell injections enhance new bone formation during distraction. J Orthop Res1999;17:900–908.CrossrefPubMed Google Scholar
14 Kitoh H , KitakojiT, TsuchiyaH, et al.Transplantation of marrow-derived mesenchymal stem cells and platelet-rich plasma during distraction osteogenesis--a preliminary result of three cases. Bone2004;35:892–898.CrossrefPubMed Google Scholar
15 Kitoh H , KitakojiT, TsuchiyaH, KatohM, IshiguroN. Transplantation of culture expanded bone marrow cells and platelet rich plasma in distraction osteogenesis of the long bones. Bone2007;40:522–528.CrossrefPubMed Google Scholar
16 Kitoh H , KitakojiT, TsuchiyaH, KatohM, IshiguroN. Distraction osteogenesis of the lower extremity in patients with achondroplasia/hypochondroplasia treated with transplantation of culture-expanded bone marrow cells and platelet-rich plasma. J Pediatr Orthop2007;27:629–634.CrossrefPubMed Google Scholar
17 Ramot Y , MeironM, TorenA, SteinerM, NyskaA. Safety and biodistribution profile of placental-derived mesenchymal stromal cells (PLX-PAD) following intramuscular delivery. Toxicol Pathol2009;37:606–616.CrossrefPubMed Google Scholar
18 Vilalta M , DéganoIR, BagóJ, et al.Biodistribution, long-term survival, and safety of human adipose tissue-derived mesenchymal stem cells transplanted in nude mice by high sensitivity non-invasive bioluminescence imaging. Stem Cells and Development2008;17:993–1004.CrossrefPubMed Google Scholar
19 Miyamoto K , NishigamiK, NagayaN, et al.Unblinded pilot study of autologous transplantation of bone marrow mononuclear cells in patients with thromboangiitis obliterans. Circulation2006;114:2679–2684.CrossrefPubMed Google Scholar
20 Kinnaird T , StabileE, BurnettMS, et al.Local delivery of marrow-derived stromal cells augments collateral perfusion through paracrine mechanisms. Circulation2004;109:1543–1549.CrossrefPubMed Google Scholar
21 Takamine Y , TsuchiyaH, KitakojiT, et al.Distraction osteogenesis enhanced by osteoblastlike cells and collagen gel. Clin Orthop Relat Res2002;399:240–246.CrossrefPubMed Google Scholar
22 Wang W , JiangQ, ZhangH, et al.Intravenous administration of bone marrow mesenchymal stromal cells is safe for the lung in a chronic myocardial infarction model. Regen Med2011;6:179–190.CrossrefPubMed Google Scholar
23 Devine SM , CobbsC, JenningsM, BartholomewA, HoffmanR. Mesenchymal stem cells distribute to a wide range of tissues following systemic infusion into nonhuman primates. Blood2003;101:2999–3001.CrossrefPubMed Google Scholar
24 Eggenhofer E, Benseler V, Kroemer A, et al. Mesenchymal stem cells are short-lived and do not migrate beyond the lungs after intravenous infusion. Front Immunol 2012;3:297. Google Scholar
25 Wang JS , Shum-TimD, ChedrawyE, ChiuRC. The coronary delivery of marrow stromal cells for myocardial regeneration: pathophysiologic and therapeutic implications. J Thorac Cardiovasc Surg2001;122:699–705.CrossrefPubMed Google Scholar
26 Murphy MP , LawsonJH, RappBM, et al.Autologous bone marrow mononuclear cell therapy is safe and promotes amputation-free survival in patients with critical limb ischemia. J Vasc Surg2011;53:1565–1574.CrossrefPubMed Google Scholar
Funding statement:
This work was supported in part by the Center for Advanced Medicine and Clinical Research, Nagoya University Hospital
Author contributions:
Y. T. Okabe: Performed the experiments, Data collection, Data analysis, Prepared the manuscript
T. Kondo: Performed the experiments, Data collection, Data analysis
K. Mishima: Performed the experiments, Data collection, Data analysis
Y. Hayase: Data collection, Data analysis
K. Kato: Supervised the experiments
M. Mizuno: Supervised the experiments
N. Ishiguro: Conceived the experiment
H. Kitoh: Designed the experiments, Prepared the manuscript
ICMJE Conflict of Interest:
None declared
©2014 The British Editorial Society of Bone & Joint Surgery. This is an open-access article distributed under the terms of the Creative Commons Attributions licence, which permits unrestricted use, distribution, and reproduction in any medium, but not for commercial gain, provided the original author and source are credited.
