


Abstract
Objectives
The most prevalent disorders of the shoulder are related to the muscles of rotator cuff. In order to develop a mechanical method for the evaluation of the rotator cuff muscles, we created a database of isometric force generation by the rotator cuff muscles in normal adult population. We hypothesised the existence of variations according to age, gender and dominancy of limb.
Methods
A total of 400 healthy adult volunteers were tested, classified into groups of 50 men and women for each decade of life. Maximal isometric force was measured at standardised positions for supraspinatus, infraspinatus and subscapularis muscles in both shoulders in every person. Torque of the force was calculated and normalised to lean body mass. The profiles of mean torque-time curves for each age and gender group were compared.
Results
Our data showed that men gradually gained maximal strength in the fifth decade, and showed decreased strength in the sixth. In women the maximal strength was gained in the fourth decade with gradual decline to the sixth decade of life. The dominant arm was stronger in most of the tested groups. The torque profiles of the rotator cuff muscles in men at all ages were significantly higher than that in women.
Conclusions
We found previously unrecognised variations of rotator cuff muscles’ isometric strength according to age, gender and dominancy in a normal population. The presented data may serve as a basis for the future studies for identification of the abnormal patterns of muscle isometric strength in patients with pathology of the rotator cuff muscles.
Cite this article: Bone Joint Res 2013;2:214–19.
Article focus
We hypothesised the existence of variations of generated force pattern of rotator cuff muscles according to age, gender and dominancy of limb in normal adult population
Key messages
We found previously unrecognised variations of isometric strength in rotator cuff muscles according to age, gender and dominancy in a normal population
In this study we determined a basis for the future development of muscle testing for diagnosis of disabilities in rotator cuff muscles
Strengths and limitations
Strength – large number of examined individuals enables meaningful statistical comparisons
Limitation – the standard testing positions for the individual muscle evaluation involve some contribution of other shoulder muscles that have synergistic mode of force generation
Introduction
The most prevalent group of disorders of shoulder is related to the pathological processes in the muscles of the rotator cuff.1-4 The intrinsic pathology of these muscles is usually expressed by pain, weakness and restriction of shoulder movements. The diagnosis of pathology of the cuff muscles is commonly based on an initial physical examination, which has limited prediction values, and can be established with a high precision by more sophisticated imaging modalities such as ultrasound and MRI. Ideally the ultimate cost-effective diagnostic tool for this purpose should combine the simplicity and low cost of the physical examination with the precision of imaging scans. As the mechanical force generated by these muscles is easily measurable, the pathology of these muscles might be identified by assessment of the isometric strengths of these muscles with comparison with the data in normal population. Unfortunately, comprehensive data on the generation of isometric force by the rotator cuff muscles in the normal population, including variations according to gender, age and dominancy, does not exist. As there are no such reference data for comparison, the evaluation of rotator cuff pathology by measurement of the generated force is currently impossible. Several attempts have been made to determine the normal values of the isometric force of the rotator cuff muscles,5-11 but these studies did not provide full data on a wide spectrum of ages in the large study groups. Those data are therefore insufficient to develop a statistically reliable diagnostic tool for evaluation of rotator cuff pathology by mechanical measurements.
In this project we hypothesised that by evaluating the isometric mechanical force generation by the shoulder rotator cuff muscle in a large number of healthy adult subjects, we would determine the essential variability of values reflecting normal adult population, according to age, gender and dominancy of the tested arm. The resulting data could then provide a statistically sound database for the future development of a clinical testing of the rotator cuff muscles.
Materials and Methods
Study group
A total of 400 healthy adult volunteers between the ages of 20 and 60 years were tested. The volunteers were recruited from the Rambam Medical Center and Faculty of Medicine staff. There were 50 men and 50 women volunteers for each decade within the age range.
None of the volunteers had a previous shoulder complaint or injury. On clinical examination performed by one of the authors (AC), they were confirmed as having no restriction of shoulder movements (active or passive), no pain in the shoulder girdle or in the cervical area and negative provocative tests for subacromial impingement or labral pathology. All the subjects had a normal observed rhythm of scapulothoracic movement.
Most of the clinically important pathological changes in the rotator cuff muscles (e.g. tears, partial or full, degeneration, such in different impingement syndromes, calcific tenditis, etc.) occur in supraspinatus (SS), infraspinatus (IS) and subscapularis (SSC) muscles. Accordingly, these structures were evaluated in the present study.
Assessment of isometric strength
Time curves of the tested muscles in both shoulders in every person were measured at standardised positions. The dominancy of the tested limb was recorded. The measurements of the isometric force were performed by a specialised dynamometer (1200 readings/sec, resolution 0.04 N; Myometer; Atlantech Medical, Nottingham, United Kingdom).
In general, the rotator cuff muscles act synergistically, but there are several testing positions when one of these muscles generates the main force.12 We used the following optimal positions for the measurements of various muscles.
Supraspinatus muscle testing
While in seated position, the tested arm was held in 45° of abduction and 30° of forward flexion with the dynamometer cuff placed above the elbow. The elbow was flexed to 90°. The lever arm of abduction force was measured between the centre of the dynamometer cuff and the point 3 cm distal to the lateral edge of acromion. This position represents the centre of rotation of the humeral head.
Subscapularis and infraspinatus muscle testing
In a supine position, the tested extremity is 30° tilted forwards and fully adducted. This positioning is chosen in order to eliminate scapular movements and to evaluate the generated forces close to the scapular plane. The dynamometer cuff was placed on the forearm and the forces were produced by the internal and external rotation of the shoulder. The connection between the dynamometer cuff and the dynamometer was kept perpendicular to the forearm, in the opposite direction to the force vector, and therefore the lever arm in this position is negligible.
Each strength measurement was performed for a time period of five seconds. This period of test was chosen as it is empirically similarly to the widely accepted Constant’s shoulder assessment scoring method.13 Two measurements were performed for each muscle in five-minute intervals and the highest results were recorded. Characteristic force-time curves were produced (Fig. 1). For the further evaluation the values from the beginning of the generated force rise and in the duration of four seconds were used in order to eliminate the artifacts of the initiation and completion of measurements. Therefore the information was recorded as sequence of measurements lasting four seconds. Each value was multiplied by the lever arm and expressed as a moment of torque. The results were normalised to the lean body mass (LBM) in order to eliminate the effect of the variations in the overall fitness conditions of the examined subjects. The LBM was calculated according to the following formulae14:
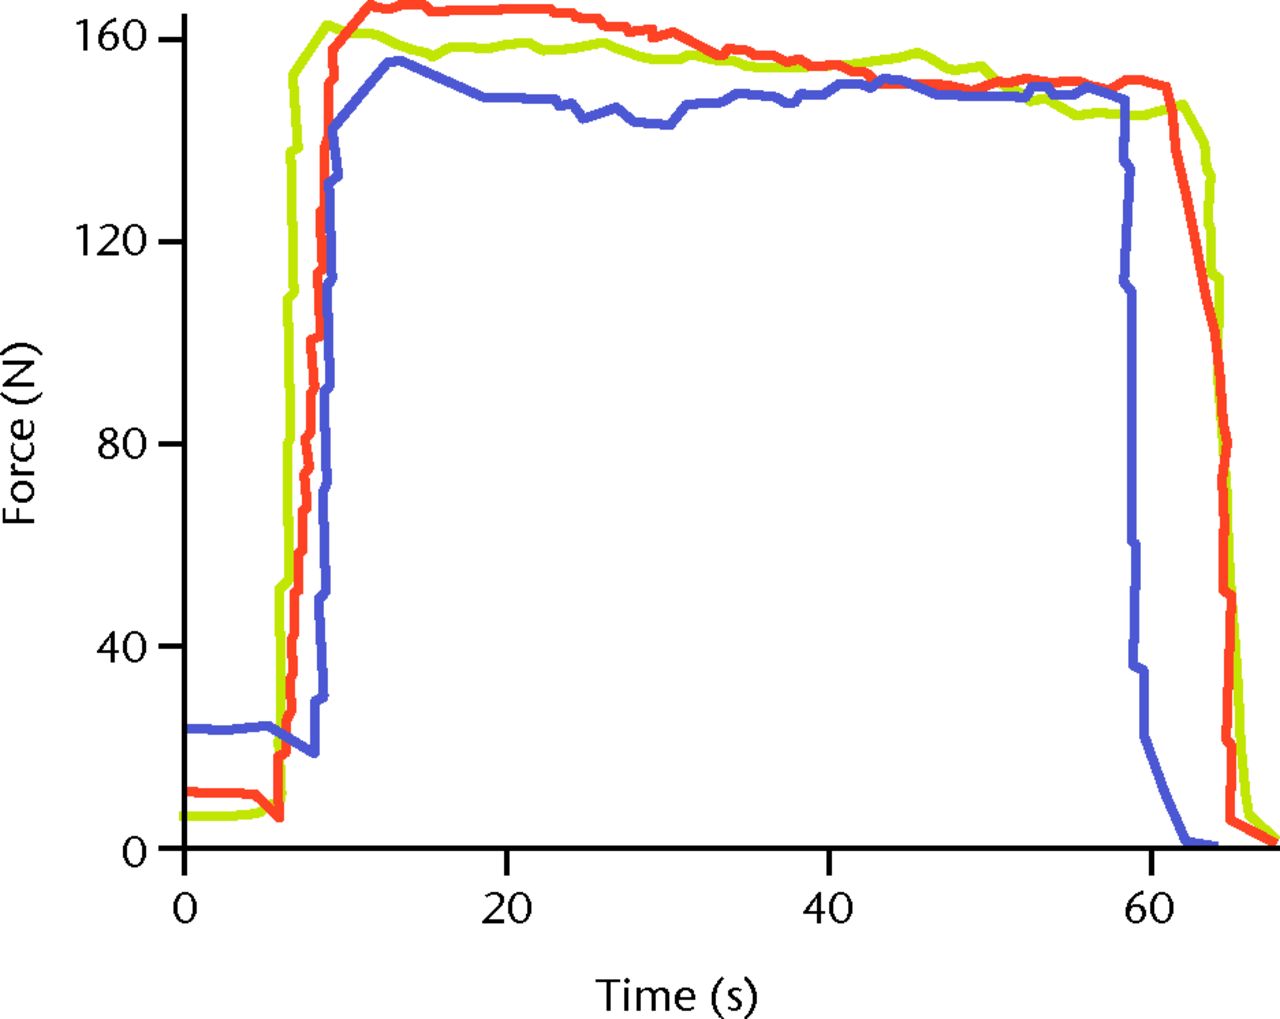
Fig. 1
Sample profiles of force–time curves as recorded by a dynamometer.
LBM (men) = (1.10×Weight) – 128×(Weight2/(100×Height2))
LBM (women) = (1.07×Weight) – 148×(Weight2/(100×Height2))
The mean values for each group were recorded and the standard deviation calculated.
This project was approved by the Institutional Ethical Committee.
Statistical analysis
We studied the force–time curves. The corresponding values of force, according to the equal time intervals, were compared by one-way analysis of variance (ANOVA) followed by post-hoc Tukey test (for comparison of pairs of result groups) after a normal distribution of values was determined by the Kolmogorov–Smirnov test. If not a normal distribution, one-way ANOVA on ranks with Student’s Newman–Keuls post-hoc test was used. A p-value < 0.05 was considered to be statistically significant. The calculations of the statistical comparisons were performed by SigmaStat software v2 (SPSS Inc., Chicago, Illinois).
Results
The results of the muscle testing in all age groups by gender are given in Table I and Figures 2 to 4. For all muscles tested, the profile of generated force was significantly higher in men in comparison to women (all p < 0.001).
Figs. 2a - 2b
Graphs showing the mean maximal torque values of isometric supraspinatus muscle testing in a) men and b) women, by dominant (D) and non-dominant (ND) side, normalised to lean body mass. For both the dominant and non-dominant arms in men, the profiles of the age groups differed in the following order: fifth > fourth > third > sixth decade (both p < 0.001). For both the dominant and non-dominant arms in women, the profiles of the age groups differed in the following order: fourth > fifth > third and sixth decades (both p < 0.001).
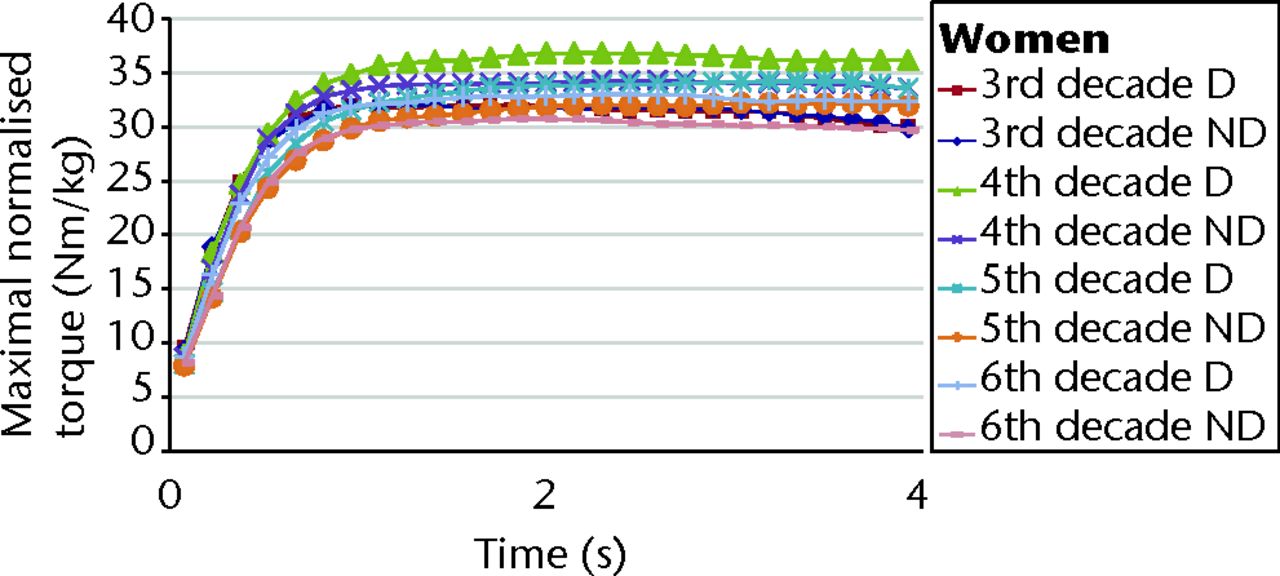
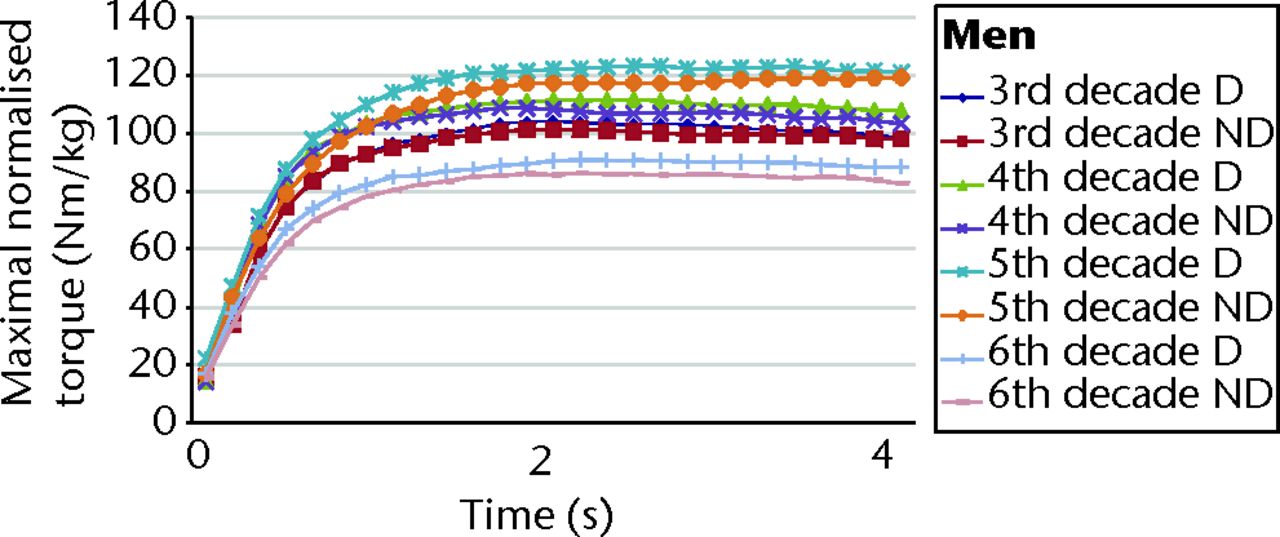
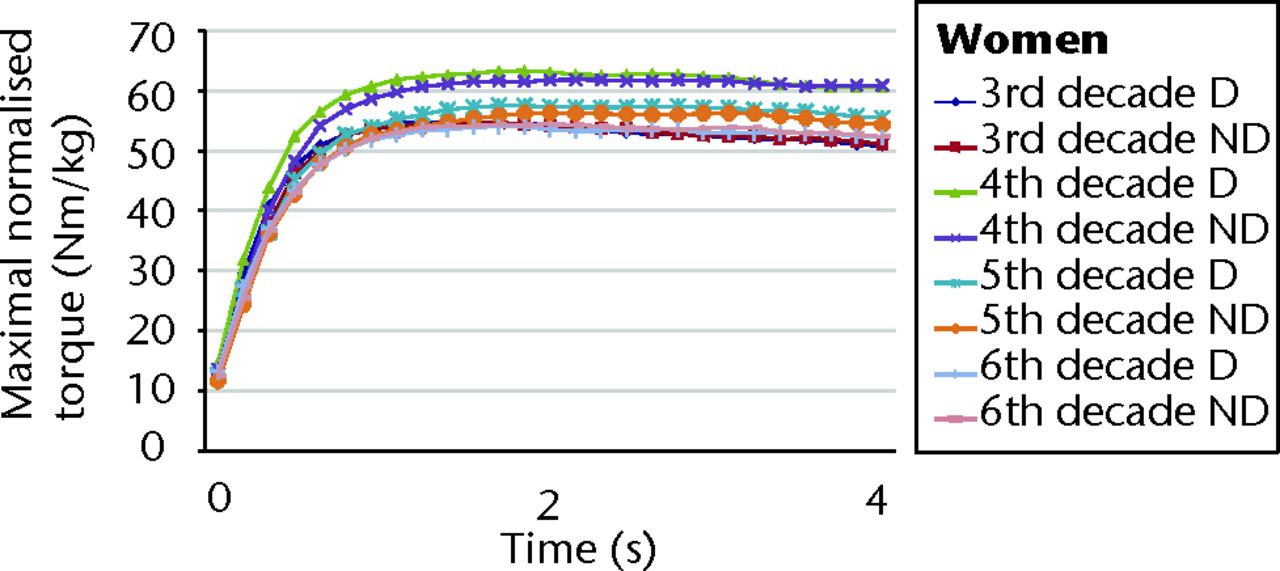
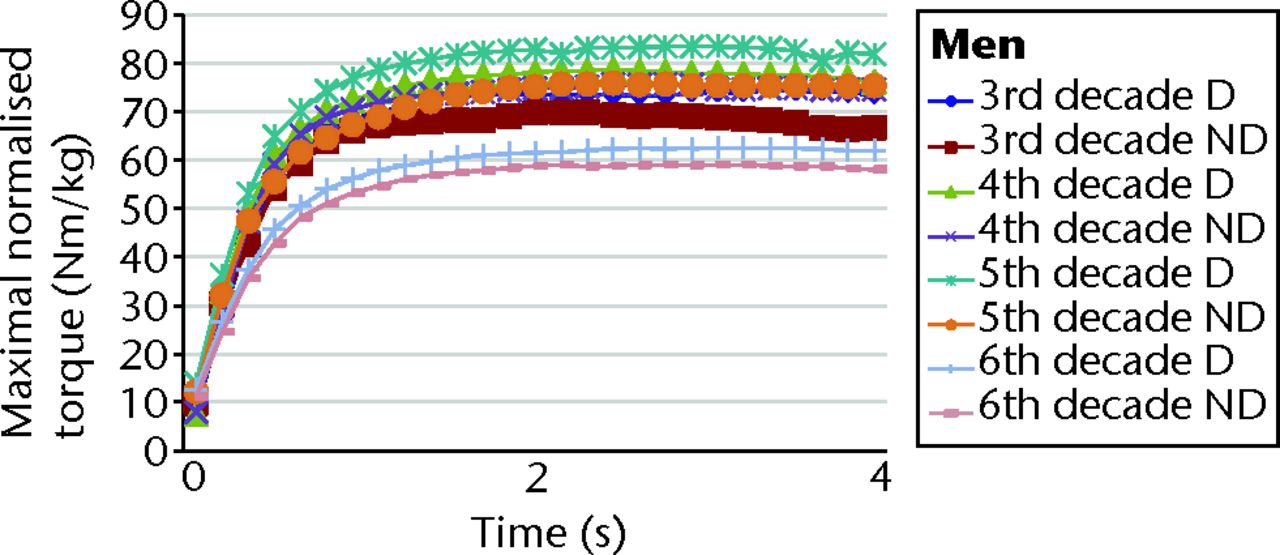
Figs. 3a - 3b
Graphs showing the mean maximal torque values of isometric infraspinatus muscle testing in a) men and b) women, by dominant (D) and non-dominant (ND) side, normalised to lean body mass. For both the dominant and non-dominant arms in men, the profiles of the age groups differed in the following order: fifth > fourth > third > sixth decade (both p < 0.001). For the dominant arm in women, the profiles of the age groups differed in the following order: fourth > fifth > third and sixth decades (p < 0.001). For the non-dominant arm in women, the profiles of the age groups differed in the following order: fourth > fifth and third > sixth decade (p < 0.001).
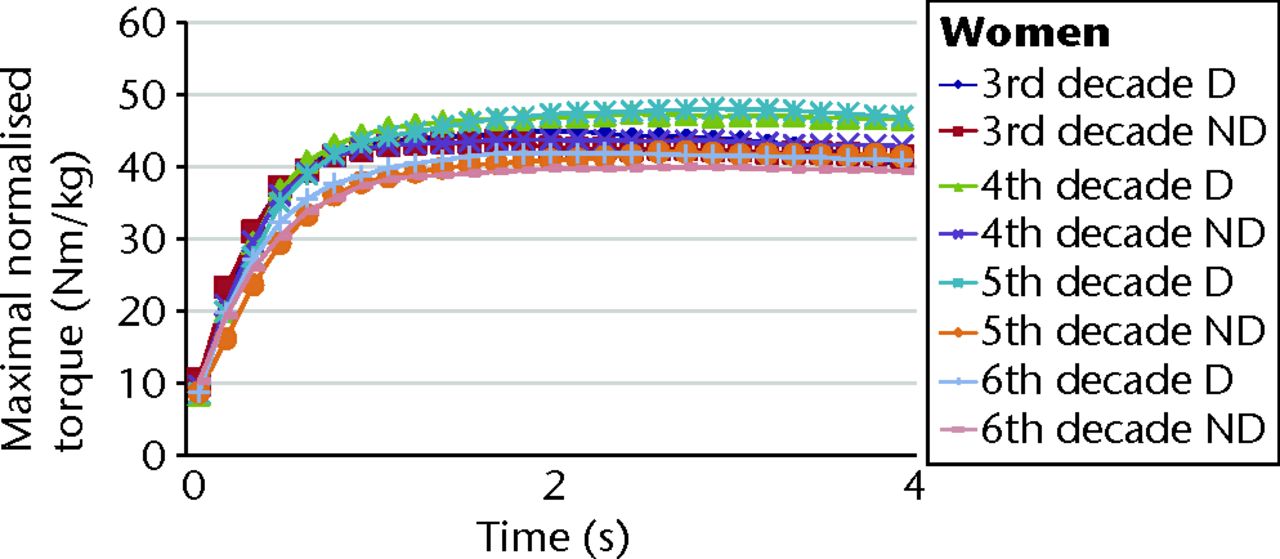
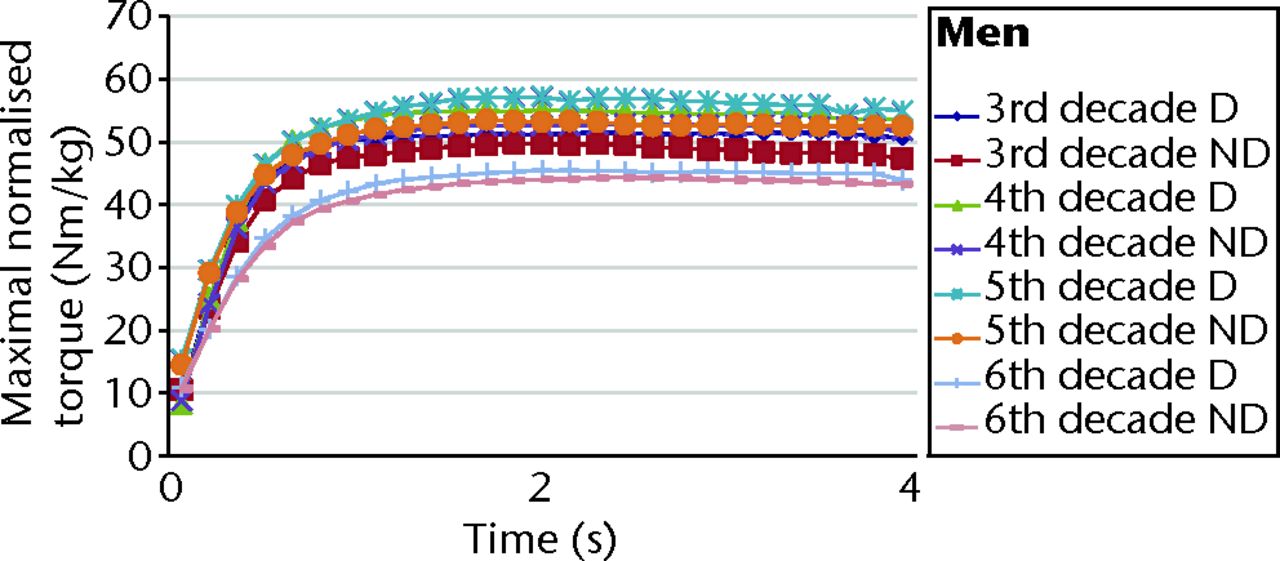
Figs. 4a - 4b
Graphs showing the mean maximal torque values of isometric subscapularis muscle testing in a) men and b) women, by dominant (D) and non-dominant (ND) side, normalised to lean body mass. For both the dominant and non-dominant arms in men, the profiles of the age groups differed in the following order: fifth > fourth > third > sixth decade (both p < 0.001). For the dominant arm in women, the profiles of the age groups differed in the following order: fifth and fourth > third > sixth decade (p < 0.001). For the non-dominant arm in women, the profiles of the age groups differed in the following order: third and fourth > fifth > sixth decade (p < 0.001).
Table I
Results of isometric muscle testing for all age groups in both genders
| Mean (sd) maximal torque (Nm/kg) | ||||
|---|---|---|---|---|
| Muscle/group | Third decade | Fourth decade | Fifth decade | Sixth decade |
| MEN | ||||
| Supraspinatus | ||||
| Dominant | 102 (35) | 110 (35) | 122 (43) | 89 (35) |
| Non-dominant | 100 (34) | 107 (34) | 116 (40) | 85 (35) |
| p-value* | 0.06 | < 0.001 | < 0.001 | < 0.001 |
| Infraspinatus | ||||
| Dominant | 51 (13) | 55 (11) | 57 (20) | 45 (16) |
| Non-dominant | 49 (13) | 52 (14) | 52 (14) | 44 (16) |
| p-value* | < 0.001 | < 0.001 | < 0.001 | < 0.001 |
| Subscapularis | ||||
| Dominant | 102 (35) | 110 (35) | 122 (43) | 89 (35) |
| Non-dominant | 69 (22) | 75 (22) | 75 (22) | 58 (22) |
| p-value* | < 0.001 | < 0.001 | < 0.001 | < 0.001 |
| WOMEN | ||||
| Supraspinatus | ||||
| Dominant | 53 (17) | 63 (23) | 57 (25) | 53 (17) |
| Non-dominant | 54 (16) | 61 (21) | 56 (22) | 54 (16) |
| p-value* | 0.15 | < 0.001 | < 0.001 | 0.09 |
| Infraspinatus | ||||
| Dominant | 33 (10) | 37 (12) | 34 (16) | 32 (9) |
| Non-dominant | 32 (10) | 34 (12) | 32 (10) | 30 (9) |
| p-value* | 0.9 | < 0.001 | < 0.001 | < 0.001 |
| Subscapularis | ||||
| Dominant | 44 (12) | 47 (18) | 47 (18) | 42 (12) |
| Non-dominant | 43 (13) | 43 (13) | 41 (22) | 40 (10) |
| p-value* | < 0.001 | < 0.001 | < 0.001 | < 0.001 |
-
* p-values for comparison between dominant and non-dominant results
Supraspinatus muscle testing
In testing of supraspinatus muscle of the dominant limb in men we found that a significantly higher profile of the force–time curves was in men in the fifth decade of life, followed by the individuals of fourth, third and sixth decades of life (p < 0.001) (Table I, Fig. 2a). The same tendency is seen in testing the isometric supraspinatus force-time profiles in the non-dominant upper limbs (p < 0.001, Fig. 2a).
In the group of men in the third decade of life there was no difference in torque–time curves of supraspinatus muscle testing between dominant and non-dominant limb (p = 0.06), but in all the other three groups the dominant upper limb generated significantly higher isometric force by the supraspinatus muscles (all p < 0.001) (Table I, Fig. 2a).
In testing of supraspinatus muscle of the dominant limb in women we found that a significantly higher profile of the force–time curves was in the fourth decade of life, followed by the individuals of the fifth decade (p < 0.001) (Table I, Fig. 2b). The values in the third and sixth decades of life were similar (p = 0.9), and both significantly lower compared with the other two age groups (p < 0.001 for both third- and sixth-decade women in comparison with fourth- and fifth-decade women) (Table I, Fig. 2b).
A similar tendency was seen in testing the isometric supraspinatus force-time profiles in the non-dominant upper limbs, with significantly higher values in the fourth and fifth decade of life (p < 0.001) compared with the third and sixth decades of life, which were similar (p = 0.15) (Table I, Fig. 2b).
In women there was no statistically significant difference between the dominant and non-dominant limb in third and sixth decades of life (p = 0.9), but there was a significant difference comparing the curves of dominant and non- dominant limbs in fourth and fifth decades of life (p < 0.001) (Table I, Fig. 2b).
Infraspinatus muscle testing
Similarly to supraspinatus, we found testing of infraspinatus muscle of the dominant limb in men to show a significantly higher profile of the force–time curves in the fifth decade of life, followed by the fourth, third and sixth decades (p < 0.001 (Table I, Fig. 3a).
Testing of infraspinatus in male non-dominant limbs showed similar high profiles in the fourth and fifth decades of life (p = 0.15), which were significantly higher than the third and sixth decades of life (both p < 0.001) (Table I, Fig. 3a). In all age groups the dominant upper limb generated significantly higher isometric force by the infraspinatus muscles (all p < 0.001, Fig. 3a).
In the dominant arm in women, we found testing of infraspinatus to result in a significantly higher force–time curve profile in the fourth decade of life compared with the other decades (p < 0.001) (Table I, Fig. 3b). There was no significant difference between the dominant limb curve’s profiles in the groups in third and sixth decades of life (p = 0.03) (Fig. 3b). In non-dominant female limbs, the significantly highest profile of the force–time curves was in the fourth decade of life (p < 0.001) in comparison with and followed by the individuals in the third and fifth decades (Fig. 3b). The lowest profile of the force–time curves in women was seen among individuals belonging to the sixth decade of life (p < 0.001) in comparison with all other age groups (Table I, Fig. 3b). In all female age groups above 30 years of age the torque–time curves of infraspinatus muscles were significantly higher in dominant limbs (p < 0.001). Those of the third decade of life showed no significant difference in the profile of the curves of the dominant and non-dominant limbs (p > 0.05, Fig. 3b).
Subscapularis muscle testing
In testing of the subscapularis muscle of the dominant limb in men we found that a significantly higher profile of the force–time curves was in men in fifth decade of life in comparison to and followed by the individuals of fourth, third and sixth decades in descending order (p < 0.001) (Table I, Fig. 4a). In male non-dominant limbs, the profile was highest in those individuals in the fourth and fifth decades, followed by those of the third and sixth decades (p < 0.001) (Table I, Fig. 4a). In all age groups the dominant arm in men generated a significantly higher force than the non-dominant arm (all p < 0.001).
In testing the subscapularis muscle of the dominant limb in women we found a significantly higher profile of the force–time curves in the fourth and fifth decades of life, followed by the individuals of third and sixth decades of life (p < 0.001) (Table I, Fig. 4b). The subscapularis force-time profiles in the non-dominant upper limbs were highest in the female individuals in the third and fourth decades of life, followed by the curves in fifth and sixth decades of life (p < 0.001) (Table I, Fig. 4b). In all the tested groups of women the dominant upper limbs generated a significantly higher isometric force by the subscapularis muscles (p < 0.001) (Table I, Fig. 4b).
Discussion
The use of a portable dynamometer for measurement of isometric muscle force is known to be precise and efficient.15 We therefore employed this method to determine the normal values of isometric force generated by the rotator cuff muscles. We chose to measure the isometric forces in positions of the arm that do not provoke subacromial impingement,12 i.e. in 45° of abduction and 30° of forward flexion for supraspinatus muscle evaluation, without reaching 90° of abduction in the scapular plane. In this position a maximal effort of the supraspinatus is generated, according to electrophysiological analysis.7 Also, secondary discomfort of subacromial irritation as a result of narrowing of the subacromial space at 90° of shoulder abduction is eliminated. The latter is of special importance, as in further studies in patients with subacromial narrowing, a comparison with the present normal values will be considered.
The present data show the expected higher profiles of the torque-time curves of all the tested rotator cuff muscles in men compared with women, and in most comparisons of dominant compared with non-dominant limbs (except supraspinatus muscles in men and women in the third decade of life, in women in the sixth decade and of infraspinatus muscle in women in third decade). Additionally, an unexpected finding showed that men gradually gained maximal strength in all tested muscles (significantly higher torque–time profiles to the fifth decade of life, before decreasing in the sixth. In women the maximal strength was gained in the fourth decade with gradual decline to the sixth decade of life. In both men and women, in the third decade of life the generated isometric force of the tested muscles of the rotator cuff were significantly lower and comparable only to the individuals in the sixth decade of life, except the values from subscapularis muscle of non-dominant arm in women (Fig. 4b). The logical explanation to the drop of the generated isometric force in the sixth decade age group might be related to development of subtle sub clinical intrinsic degenerative changes in the rotator cuff muscles in this age group.3,11 But the reason for the relatively low profiles of the generated muscle force in third decade of life is not obvious. Some indication of these unexpected findings can be found in previous reports8,16 of small groups of tested individuals with non-normalised reported data. In the present study we provide substantial data to show that normal individuals of both genders in the third decade of life do not reach the maximal isometric strength in their rotator cuff muscles. The reason for this phenomenon is not clear but it might have an important impact on determining goals of physical activities and muscle rehabilitation in this age group. Further studies are needed to explain the reason for the observed gradual increase in muscle strength far until the fourth and fifth decades of life.
In this study we determined a basis for the future development of muscle testing for diagnosis of disabilities in rotator cuff muscles. The recognition of the normal values of isometric strength of the rotator cuff muscles will enable identification of the abnormal patterns of muscle isometric strength in patients with shoulder rotator cuff pathology in future studies. Recognition of these patterns might provide a reliable tool for a development of an effective strength testing method for diagnosis of disorders in the rotator cuff.
1 Jerosch J , MüllerT, CastroWH. The incidence of rotator cuff rupture: an anatomic study. Acta Orthop Belg1991;57:124–129. Google Scholar
2 Lehman C , CuomoF, KummerFJ, ZuckermanJD. The incidence of full thickness rotator cuff tears in a large cadaveric population. Bull Hosp Jt Dis1995;54:30–31.PubMed Google Scholar
3 Milgrom C , SchafflerM, GilbertS, van HolsbeeckM. Rotator-cuff changes in asymptomatic adults: the effect of age, hand dominance and gender. J Bone Joint Surg [Br]1995;77-B:296–298. Google Scholar
4 Sher JS , UribeJW, PosadaA, MurphyBJ, ZlatkinMB. Abnormal findings on magnetic resonance images of asymptomatic shoulders. J Bone Joint Surg [Am]1995;77-A:10–15.PubMed Google Scholar
5 Hayes K , WaltonJR, SzomorZL, MurrellGA. Reliability of 3 methods for assessing shoulder strength. J Shoulder Elbow Surg2002;11:33–39.CrossrefPubMed Google Scholar
6 Hughes RE , AnKN. Force analysis of rotator cuff muscles. Clin Orthop Relat Res1996;330:75–83.CrossrefPubMed Google Scholar
7 Jenp YN , MalangaGA, GrowneyES, AnKN. Activation of rotator cuff in generating isometric shoulder rotation torque. Am J Sports Med1996;24:477–485. Google Scholar
8 Stoll T, Huber E, Seifert B, Stucki G, Michel BA. Isometric muscle strength measurement. Thieme: Stuttgart, 2002:35–37. Google Scholar
9 Bäckman E , JohanssonV, HägerB, SjöblomP, HenrikssonKG. Isometric muscle strength and muscular endurance in normal persons aged between 17 and 70 years. Scan J Rehabil Med1995;27:109–117.PubMed Google Scholar
10 Hughes RE , JohnsonME, O’DriscollSW, AnKN. Age related changes in normal isometric shoulder strength. Am J Sports Med1999;27:651–657. Google Scholar
11 Kim HM , TeefeySA, ZeligA, et al.Shoulder strength in asymptomatic individuals with impact compared with torn rotator cuffs. J Bone Joint Surg [Am]2009;91-A:289–296. Google Scholar
12 Kuhlman JR , IannotiJP, KellyMJ, et al.Isokinetic and isometric measurement of strength of external rotation and abduction of the shoulder. J Bone Joint Surg [Am]1992;74-A:1320–1333.CrossrefPubMed Google Scholar
13 Bankes MJ , CrossmanJE, EmeryRJ. A standard method of shoulder strength measurement for the Constant score with a spring balance. J Shoulder Elbow Surg1998;7:116–121.CrossrefPubMed Google Scholar
14 Hallynck TH , SoepHH, ThomisJA, et al.Should clearance be normalised to body surface or to lean body mass?Br J Clin Pharmacol1981;11:523–526. Google Scholar
15 Kolber MJ , BeekhuizenK, ChengMS, FiebertIM. The reliability of hand-held dynamimetry in measuring isometric strength of the shoulder internal and external rotator musculature using a stabilizing device. Physiother Theory Pract2007;23:119–124. Google Scholar
16 Murray MP , GoreDR, GardnerGM, MollingerLA. Shoulder motion and muscle strength of normal men and women in two age groups. Clin Orthop Relat Res1985;192:268–273.PubMed Google Scholar
Funding statement:
No funding received
Author contributions:
A. Chezar: Data collection, Data analysis
Y. Berkovitch: Data collection, Data analysis
M. Haddad: Data collection, Data analysis
Y. Keren: Data collection, Data analysis
M. Soudry: Data collection, Data analysis
N. Rosenberg: Data collection, Data analysis, Writing the paper
ICMJE Conflict of Interest:
None declared
©2013 The British Editorial Society of Bone & Joint Surgery. This is an open-access article distributed under the terms of the Creative Commons Attributions licence, which permits unrestricted use, distribution, and reproduction in any medium, but not for commercial gain, provided the original author and source are credited.
