


Abstract
Aims
The aim of this study was to explore the genetic correlation and causal relationship between blood plasma proteins and rheumatoid arthritis (RA).
Methods
Based on the genome-wide association studies (GWAS) summary statistics of RA from European descent and the GWAS summary datasets of 3,622 plasma proteins, we explored the relationship between RA and plasma proteins from three aspects. First, linkage disequilibrium score regression (LD score regression) was applied to detect the genetic correlation between RA and plasma proteins. Mendelian randomization (MR) analysis was then used to evaluate the causal association between RA and plasma proteins. Finally, GEO2R was used to screen the differentially expressed genes (DEGs) between patients with RA and healthy controls.
Results
We found that seven kinds of plasma proteins had genetic correlations with RA, such as Soluble Receptor for Advanced Glycation End Products (sRAGE) (correlation coefficient = 0.2582, p = 0.049), vesicle transport protein USE1 (correlation coefficient = 0.1337, p = 0.018), and spermatogenesis-associated protein 20 (correlation coefficient = 0.3706, p = 0.018). There was a significant causal relationship between sRAGE and RA. By comparing the genes encoding seven plasma proteins, we found that only USE1 was a DEG associated with RA.
Conclusion
Our study identified a set of candidate plasma proteins that showed signals correlated with RA. Since the results of this study need further experimental verification, they should be interpreted with caution. However, we hope that this paper will provide new insights for the discovery of pathogenic genes and RA pathogenesis in the future.
Cite this article: Bone Joint Res 2022;11(2):134–142.
Article focus
-
To explore the genetic correlation and causal relationship between blood plasma proteins and rheumatoid arthritis (RA).
Key messages
-
We analyzed the genetic association between 3,622 plasma proteins and RA, and found that seven plasma proteins were genetically associated with RA.
-
There is a significant causal relationship between Soluble Receptor for Advanced Glycation End Products and RA.
-
By comparing with the genes encoding seven plasma proteins, it was found that USE1 was the differentially expressed gene associated with RA.
Strengths and limitations
-
This is the first study to systematically detect the genetic correlations between RA and plasma proteins based on large genome-wide association studies (GWAS) summary data sources.
-
The GWAS summary data are based on European descent and may not be applicable to other lineage studies.
Introduction
Rheumatoid arthritis (RA) is a chronic immune-related joint disease that can lead to cartilage and bone damage, and even disability.1,2 The disease affects approximately 1% of the population,3 with a male-to-female ratio of 2.5:1. It can occur at any age, but it is most common in people aged 40 to 70 years, and its incidence increases with age.1,4 The heritability of RA is estimated to be approximately 60%.5 Genome-wide association studies (GWAS) are a powerful way to understand the genetic basis of many complex traits in common human diseases.6 In addition to genetic factors, environmental effects play indispensable roles in the pathogenesis of RA, such as blood transfusion, smoking, and obesity.7,8 Through fine mapping, candidate gene methods, and meta-analysis in GWAS, multiple sites containing RA susceptibility variants were identified in the whole genome.9 RA is a complex disease affected by multiple genes, and its aetiology is unknown. Therefore, we sought to further explore its pathogenesis from a genetic point of view.
Plasma proteins (also known as blood proteins) are a group of proteins in plasma. To date, more than 3,600 plasma proteins have been identified that are functionally related in signal transduction, transport, repair, and prevention of infection.10 Some studies have found that plasma proteins are related to the occurrence and development of RA,11 and that plasma proteins play a certain role in early disease diagnosis and targeted treatment.12 However, limited efforts have been made to comprehensively explore the genetic and causal relationship between RA and plasma proteins. In addition, due to the rapid development of metabolomics, the role of blood metabolites in orthopaedic diseases has also received attention from the public.13
Genetic correlation is a parameter used to describe the genetic correlation between complex traits and diseases. Linkage disequilibrium score regression (LD score regression) is one of the most popular genetic correlation analysis methods at present. A more important use of linkage disequilibrium is the estimation and correction of confusion.14 Although LD score regression can assess the genetic correlation between RA and plasma protein, it is impossible to determine whether there is a causal relationship between them. To address the confounding factors in the observation study and determine their causality, an alternative method is needed: the Mendelian randomized (MR) experiment based on the Mendelian independent classification rule. This analysis method is more valuable, especially when randomized controlled trials to test causality are not feasible and observational studies provide biased associations due to confusion or reverse causality.15 Based on LD score regression and MR analysis, Kappelmann et al16 reported a genetic correlation between CRP levels and depressive symptoms in individuals, and the MR correlation suggested that higher BMI may be a causal risk factor for loss of pleasure, fatigue, and appetite changes.
In this study, using large-scale GWAS summary datasets of plasma proteins and the GWAS summary statistics of RA, LD score regression and MR were used for the first time to explore the genetic correlation and causal relationship between plasma proteins and RA, which may provide new ideas for the genetic mechanism, diagnosis, and treatment of RA.
Methods
GWAS summary data of RA
We included GWAS summary data of RA from a study published by Okada et al,17 which included 29,880 RA cases and 73,758 controls. They performed genotyping, quality control, and genotype interpolation on GWAS data. The associations between single nucleotide polymorphisms (SNPs) and RA were evaluated by a logistic regression model.17 They identified 42 new RA risk loci at the genome-wide level, bringing the total to 101. A more detailed description can be found in a study by Okada et al.17
GWAS summary data of the human plasma proteome
The GWAS summary data of the human plasma proteome were derived from a genetic map of the human plasma proteome, which included 3,622 plasma proteins from 3,301 healthy participants, including 50,000 blood genomic biological resources from 25 medical centres in England.10 Genotyping was performed on the Affymetrix Axiom UK Biobank genotyping array (Affymetrix, USA).18 Simple linear regression using an additive genetic model was used to test genetic associations. After quality control, the GWAS summary data of 3,283 plasma proteins were used in the following genetic correlation analysis. A detailed description of the study participants, plasma sample preparation, protein measurements, and statistical analysis can be found in a previously published study by Sun et al.10
Genetic correlation analysis
Using the LD score regression method as developed in a previous study,14,19 we were able to assess the contribution of each factor by testing the relationship between statistics and linkage disequilibrium. In GWAS studies, both polygenicity and the bias caused by interfering factors cause the distribution of the tested statistics to be high. However, we could not determine whether the high statistics were from polygenicity or interference factors so that we could quantitatively analyze the influence of each part by studying the relationship between the statistics and the linkage disequilibrium through LD score regression.14
Assessing causal relationships between RA and plasma proteins
The causal relationship between the plasma proteome and RA was assessed using the inverse variance-weighted (IVW) model of a bidirectional MR study. The method of MR-Egger regression analysis can be used to evaluate the bias that gene pleiotropy brings, and the slope of the MR-Egger regression line can estimate the size of directional pleiotropy.20 The weighted median calculator has the advantage of retentive larger precision within the estimates compared with the MR-Egger analysis.21 Tests were considered statistically significant at p < 0.05. The MR base platform was used for MR analyses.22
Screening of differentially expressed genes related to RA
The Gene Expression Omnibus (GEO)23 database is a public functional genomics data warehouse that contains a large number of gene expression data, chips, and microarrays.24 The chip expression profile dataset of GSE56649, which contains 13 RA and nine normal samples, was downloaded from the GEO database.25 GEO2R, as an analysis tool of GEO, was used to screen differentially expressed genes (DEGs) between RA patients and healthy controls.26 Then, we looked for the plasma protein genes genetically related to RA in DEGs to verify whether the plasma proteins genetically related to RA were differentially expressed at the DNA level in patients with RA.
Results
First, the GWAS summary data of RA and plasma proteins were used for genetic correlation analysis, and seven plasma proteins were screened and identified. The results showed that the Soluble Receptor for Advanced Glycation End Products (sRAGE) has a causal relationship with RA. Finally, we compared the gene expression profiles of RA with the genes encoding seven plasma proteins and found that the gene encoding USE1 was related to the pathogenesis of RA (Figure 1).
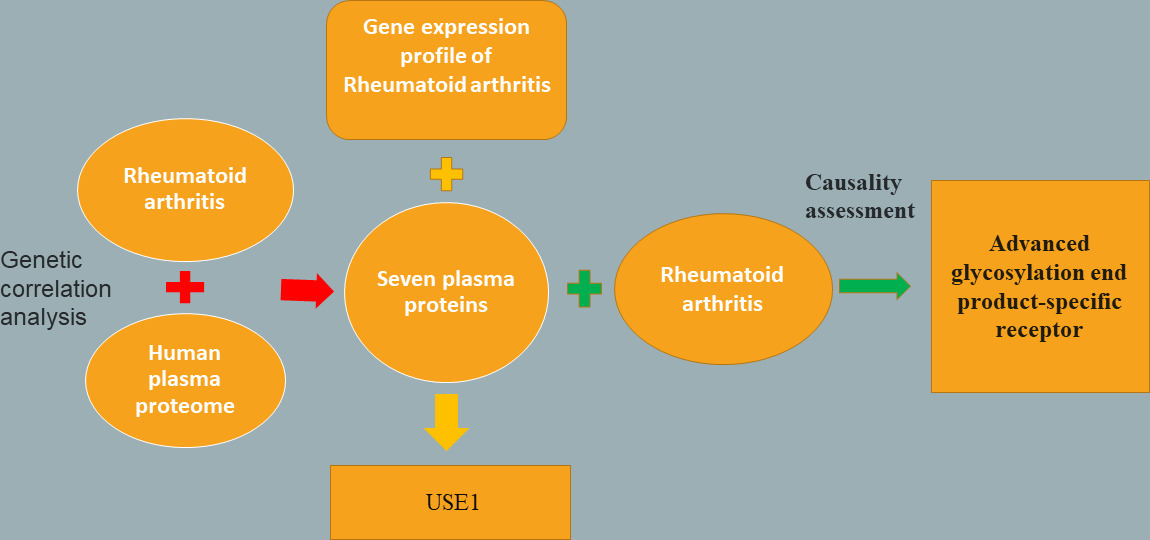
Fig. 1
Detailed flowchart of the result.
Analysis of genetic correlations between RA and the plasma proteome
We found that seven suggestive plasma proteins were genetically correlated with RA (Figure 2), including sRAGE (correlation coefficient = 0.2582, p = 0.049), vesicle transport protein USE1 (correlation coefficient = 0.1337, p = 0.018), spermatogenesis-associated protein 20 (correlation coefficient = 0.3706, p = 0.018), recombinant glycophorin A (correlation coefficient = 0.2304, p = 0.029), cysteine-rich secretory protein 2 (CRISP2) (correlation coefficient = 0.0850, p = 0.046), sodium/potassium-transporting ATPase subunit beta-2 (correlation coefficient = 0.4097, p = 0.046), and carbohydrate sulfotransferase 6 (correlation coefficient = 0.1435, p = 0.042, all LD score regression) (Table I).
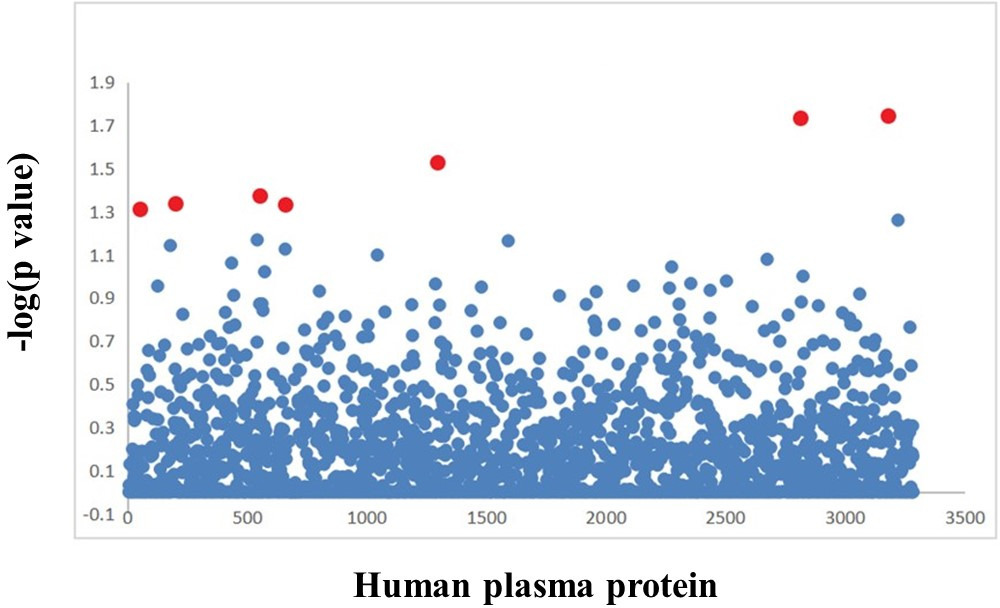
Fig. 2
The scatter plot of the results obtained by genetic correlation analysis between rheumatoid arthritis and human plasma protein. Each dot represents a plasma protein. Red dots represent plasma proteins with genetic correlation. The x-axis represents the plasma protein, and the y-axis represents the negative logarithm of the p-value.
Table I.
Genetic correlation between human plasma protein and rheumatoid arthritis.
| Blood plasma protein | Gene | Genetic correlation | p-value* |
|---|---|---|---|
| Soluble Receptor for Advanced Glycation End Products | AGER | 0.2582 | 0.049 |
| Vesicle transport protein USE1 | USE1 | 0.1337 | 0.018 |
| Spermatogenesis-associated protein 20 | SPATA20 | 0.3706 | 0.018 |
| Recombinant Glycophorin A | GYPA | 0.2304 | 0.029 |
| Cysteine-rich secretory protein 2 | CRISP2 | 0.085 | 0.046 |
| Sodium/potassium-transporting ATPase subunit beta-2 | AT1B2 | 0.4097 | 0.046 |
| Carbohydrate sulfotransferase 6 | CHST6 | 0.1435 | 0.042 |
-
The Mendelian randomization (MR) base platform was used for MR analyses.22
-
p < 0.05 indicates statistical significance.
-
*
Linkage disequilibrium score regression.
Causal relationship between plasma protein and RA
Based on the IVW model of MR analysis, there was a significant causal relationship between sRAGE (exposure) and RA (outcome) (β = -0.9649, standard error (SE) = 0.4049, p = 0.017) (Table II, Figure 3). The results of weighted median model analysis (β = -0.1389, SE = 0.0697, p = 0.046) and MR Egger model analysis (β = -2.4760, SE = 0.0892, p = 0.001) were consistent with those of IVW. In addition, based on the IVW model, MR analysis found that there was a causal relationship between RA (exposure) and sRAGE (outcome) (β = -0.1290, SE = 0.0419, p = 0.002) (Table III, Figure 4). The result of MR Egger regression shows that horizontal pleiotropy may affect the results (intercept = 0.0280, p = 0.031). In addition, MR Egger model analysis showed that there was a causal relationship between RA and sRAGE (β = -0.233, SE = 0.061, p = 0.001). However, the analysis using the weighted median method did not show a significant causal relationship between them (β = -0.0440, SE = 0.0370, p = 0.229) (Table III).
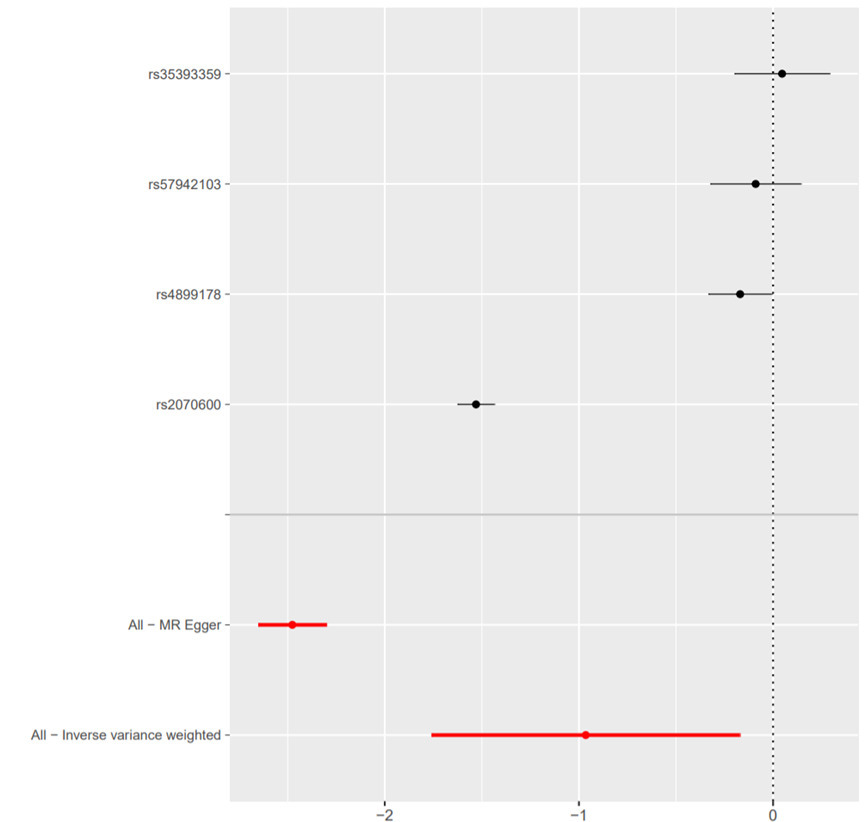
Fig. 3
Forest plot of causality between Soluble Receptor for Advanced Glycation End Products-related single nucleotide polymorphism (SNP) and rheumatoid arthritis. The causal effect of exposure on outcome is estimated using each SNP singly using the Wald ratio; the Mendelian randomization (MR) estimate using all SNPs using the MR Egger and inverse variance-weighted methods are also shown.
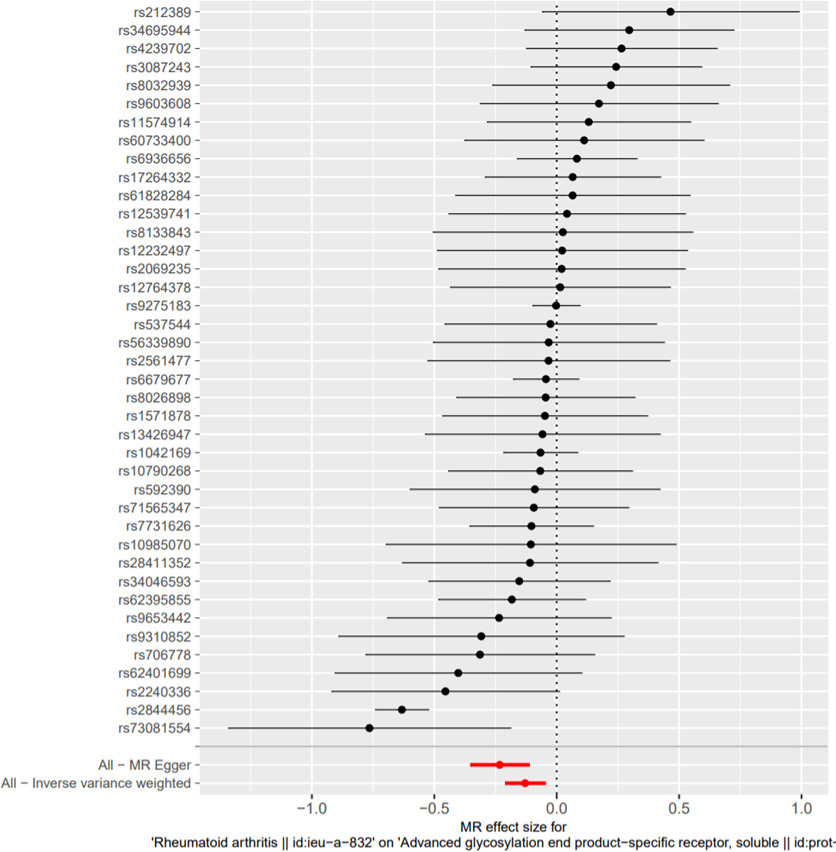
Fig. 4
Forest plot of Mendelian randomization (MR) analysis of rheumatoid arthritis related single nucleotide polymorphism (SNP) and Soluble Receptor for Advanced Glycation End Products. The causal effect of exposure on outcome is estimated using each SNP singly using the Wald ratio; the MR estimate using all SNPs using the MR Egger and inverse variance-weighted methods are also shown.
Table II.
The results of causal analysis of plasma protein (exposure) and rheumatoid arthritis (outcome).
| Exposure group | Outcome group | Number of SNPs | Analytical model | β | SE | p-value* |
|---|---|---|---|---|---|---|
| Soluble Receptor for Advanced Glycation End Products | RA | 4 | IVW | -0.9649 | 0.4049 | 0.017 |
| MR Egger | -2.4760 | 0.0892 | 0.001 | |||
| Weighted median | -0.1389 | 0.0657 | 0.034 | |||
| Spermatogenesis-associated protein 20 | RA | 1 | Wald ratio | -0.1203 | 0.0959 | 0.210 |
| Cysteine-rich secretory protein 2 | RA | 1 | Wald ratio | -0.0174 | 0.0352 | 0.620 |
| Sodium/potassium-transporting ATPase subunit beta-2 | RA | 1 | Wald ratio | -0.0687 | 0.0834 | 0.410 |
-
Since no single nucleotide polymorphism in the other three plasma proteins (vesicle transport protein USE1, cysteine-rich secretory protein 2, and carbohydrate sulfotransferase 6) can perform causal analysis, these have not been listed here.
-
p < 0.05 indicates statistical significance.
-
*
Mendelian randomization.
-
IVW, inverse variance-weighted; MR, Mendelian randomization; RA, rheumatoid arthritis; SE, standard error; SNP, single nucleotide polymorphism.
Table III.
The results of causal analysis of rheumatoid arthritis (exposure) and plasma protein (outcome).
| Exposure group | Outcome group | Methods | Number of SNPs | β | SE | p-value* |
|---|---|---|---|---|---|---|
| RA | Soluble Receptor for Advanced Glycation End Products | MR Egger | 40 | -0.2330 | 0.0612 | 0.001 |
| Weighted median | 40 | -0.0440 | 0.0354 | 0.213 | ||
| Inverse variance weighted | 40 | -0.1292 | 0.0419 | 0.002 | ||
| Spermatogenesis-associated protein 20 | MR Egger | 40 | 0.0806 | 0.0370 | 0.035 | |
| Weighted median | 40 | 0.0614 | 0.0360 | 0.088 | ||
| Inverse variance weighted | 40 | 0.0248 | 0.0250 | 0.319 | ||
| Cysteine-rich secretory protein 2 | MR Egger | 40 | 0.0025 | 0.0353 | 0.942 | |
| Weighted median | 40 | 0.0002 | 0.0368 | 0.994 | ||
| Inverse variance weighted | 40 | 0.0033 | 0.0229 | 0.884 | ||
| Sodium/potassium-transporting ATPase subunit beta-2 | MR Egger | 40 | 0.0275 | 0.0404 | 0.499 | |
| Weighted median | 40 | 0.0122 | 0.0356 | 0.731 | ||
| Inverse variance weighted | 40 | -0.0013 | 0.0263 | 0.958 | ||
| Carbohydrate sulfotransferase 6 | MR Egger | 40 | -0.0183 | 0.0399 | 0.648 | |
| Weighted median | 40 | -0.0138 | 0.0346 | 0.688 | ||
| Inverse variance weighted | 40 | -0.0318 | 0.0257 | 0.216 | ||
| Vesicle transport protein USE1 | MR Egger | 40 | -0.0220 | 0.0398 | 0.583 | |
| Weighted median | 40 | -0.0070 | 0.0338 | 0.834 | ||
| Inverse variance weighted | 40 | 0.011 | 0.026 | 0.668 |
-
Since no single nucleotide polymorphism in Recombinant Glycophorin A can perform causal analysis, it has not been listed here.
-
p < 0.05 indicates statistical significance.
-
*
Mendelian randomization.
-
MR, Mendelian randomization; RA, rheumatoid arthritis; SE, standard error; SNP, single nucleotide polymorphism.
MR analysis showed that there was no significant causal relationship between RA (exposure variable) and the other six plasma proteins (outcome variable) (Table II and Table III).
Screening of differentially expressed genes related to RA
The GSE56649 dataset contains CD4+ T cell samples from 13 RA patients and nine healthy controls from CD4+ T cell samples. After screening DEGs by GEO2R, a total of 14,119 genes with p < 0.05 were screened, including 7,509 upregulated genes and 6,610 downregulated genes (Figure 5). By comparing the genes of seven plasma proteins, it was found that USE1 was the DEG related to RA. The genes that encode the other six plasma proteins are not DEGs related to RA (Table IV).
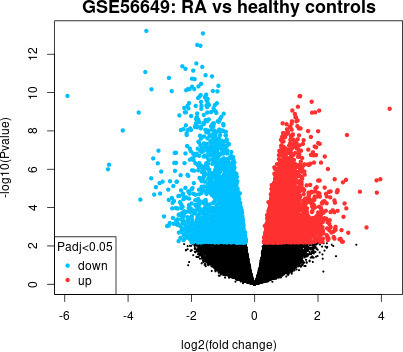
Fig. 5
Volcano plot of differentially expressed genes (DEGs) between patients with rheumatoid arthritis (RA) and healthy control individuals. The chip expression profile data set of GSE56649, which contains 13 RA and nine normal samples, was downloaded from the Gene Expression Omnibus (GEO) database. We used GEO2R to analysis the DEG.26 The results were output to the volcano map, in which blue represents down-regulated expression and red represents up-regulated expression.
Table IV.
Differential expression of genes encoding seven plasma proteins in rheumatoid arthritis.
| Plasma protein | Gene | p-value* | LogFC |
|---|---|---|---|
| Soluble Receptor for Advanced Glycation End Products | AGER | 0.414 | -0.3130 |
| Vesicle transport protein USE1 | USE1 | 0.001 | 0.4760 |
| Spermatogenesis-associated protein 20 | SPATA20 | 0.148 | -0.2400 |
| Recombinant Glycophorin A | GYPA | 0.304 | -0.7600 |
| Cysteine-rich secretory protein 2 | CRISP2 | 0.564 | -0.4070 |
| Sodium/potassium-transporting ATPase subunit beta-2 | ATP4B | 0.618 | 0.1540 |
| Carbohydrate sulfotransferase 6 | CHST6 | 0.717 | -0.1360 |
-
GEO2R was used to screen the differentially expressed genes between patients with rheumatoid arthritis and healthy controls.26
-
p < 0.05 indicates statistical significance.
-
*
Linkage disequilibrium score regression.
Discussion
Using GWAS summary data of RA and GWAS summary datasets of 3,622 plasma proteins, we conducted LD score regression analysis and found that there were genetic correlations between RA and seven kinds of plasma proteins. Since the main goal of our study was to analyze the plasma proteins that are genetically associated with RA and to discover the role of plasma proteins in the pathogenesis of RA, we hoped to further identify which of the screened plasma proteins can cause RA. Then, we analyzed the causal relationship between these seven plasma proteins and RA, and found that only sRAGE and RA had causal relationships with each other; there was no significant causal relationship between the other six plasma proteins and RA. By comparing the DEGs related to RA with the genes of seven plasma proteins, we found that only USE1 was a DEG related to RA. Since causal analysis could not be performed on any SNPs in the other three plasma proteins (vesicle transport protein USE1, CRISP2, and carbohydrate sulfotransferase 6), they are not listed, although our results were not influenced.
sRAGE are multiligand members of the immunoglobulin superfamily that are expressed in the form of cell surface molecules and interact with a variety of ligands.27 Pullerits et al28 found that compared with healthy people and patients with non-inflammatory joint diseases, sRAGE in patients with RA is significantly lower than that in healthy people and patients with non-inflammatory joint diseases. sRAGE may block the ligand–RAGE interaction on the cell surface by directly binding leucocyte β2-integrin Mac-1 and thereby decreasing the influx of inflammatory cells into the joint cavity, functioning as an immune surveillance mechanism.28 Lower levels of sRAGE detected in RA patients might thus increase the propensity towards inflammation, since RAGE ligands have better access to cell membrane-bound receptors, the binding of which leads to the activation of inflammatory pathways.28 This is consistent with our results, indicating that there is a genetic correlation between sRAGE and RA, and that there is a causal relationship between them.
USE1 is a protein-coding gene. Diseases associated with USE1 include anteroseptal myocardial infarction and childhood malignant schwannoma. Among its related pathways are Golgi-to-endoplasmic reticulum (ER) retrograde transport and vesicle-mediated transport. USE1 proteins are frequently overexpressed in lung cancer, and missense mutations in USE1 prolong the half-life of the protein, promoting tumour formation.29 Our study found that there is a genetic correlation between the vesicle transport protein USE1 and RA, and USE1 is differentially expressed in patients with RA. However, few researchers have studied whether USE1 plays a role in patients with RA, and further functional studies are warranted to explore the underlying genetic mechanisms of USE1 involved in the development of RA.
Recombinant glycoprotein A (encoded by GYPA) is a high-level glycoprotein present on the surface of red blood cells, and can be used as a bait receptor for viral pathogens.30 The protein is associated with malaria31 and hepatitis A.32 The activity of CRISP2 has recently been associated with oxidative stress and decreased lung function caused by exposure to smoke or specific substances.33 In another study, it was found that the expression of CRISP2 eliminated the process of neovascularization induced by exogenous growth factors.34 Therefore, the potential involvement of CRISP2 in RA pathology and angiogenesis through oxidative stress and inflammation is worthy of further study. Sodium/potassium-transporting ATPase subunit beta-2 is also known as ATP1B2. The protein encoded by this gene belongs to the family of Na+/K+ and H+/K+ ATPase beta chain proteins and to the subfamily of Na+/K+-ATPases.35,36 Na+/K+-ATPase is an integral membrane protein responsible for establishing and maintaining the electrochemical gradients of Na and K ions across the plasma membrane.35 These gradients are essential for osmoregulation, sodium-coupled transport of a variety of organic and inorganic molecules, and electrical excitability of nerves and muscles.37 We found that there is a genetic correlation between ATP1B2 and RA, but no study has explored the role of this gene in RA, which requires further research. Carbohydrate sulfotransferase 6 is encoded by CHST6. CHST6 is also known as C-GlcNAc6ST, and Pablos et al38 found that transcripts encoding GlcNAc6ST-2, as well as the related sulfotransferase GlcNAc6ST-1, were significantly upregulated in rheumatoid synovium compared to healthy control tissue at all timepoints examined.
This is the first study to systematically detect the genetic correlations between RA and plasma proteins based on large GWAS summary data sources, and we verified not only whether plasma proteins affect RA, but also whether RA affects plasma proteins. Finally, we verified whether plasma proteins genetically correlated with RA were differentially expressed at the DNA level in patients with RA. These results provide novel clues for the future study of the genetic mechanisms of RA and plasma proteins.
Of course, our study also has some limitations. First, the GWAS summary data are based on European descent and may not be applicable to other lineage studies. Since causality may depend on race and selection bias, further LD score regression and MR analysis of other populations is needed. Second, the inference of causality should ideally rely on many types of research because MR analysis depends on three key hypotheses, which are not always satisfiable or completely testable. Third, when screening differential genes related to RA, we analyzed only one database, which may bias the results of the study. After many tests and corrections, the significance threshold should be p < 1.38 × 10⁵. Unfortunately, according to our results, there is no significant genetic correlation at this threshold. Since experimental verification was not conducted on our results, we used the existing expression profile of RA for verification. Therefore, our findings need to be interpreted carefully, and further experiments are needed for confirmation.
In conclusion, based on the GWAS summary statistics of RA and the GWAS summary datasets of plasma proteins in the European population, we detected seven plasma proteins that showed genetic correlations with RA through LD score regression analysis and found that there was a causal relationship between sRAGE and RA. In addition, the gene-encoding vesicle transport protein USE1 was differentially expressed at the DNA level in patients with RA. Our findings provide a new possibility to study the genetic mechanism, diagnosis, and treatment of RA in the future. Since the results of this study need further experimental verification, they should be interpreted with caution.
References
1. Smolen JS , Aletaha D , McInnes IB . Rheumatoid arthritis . Lancet . 2016 ; 388 ( 10055 ): 2023 – 2038 . Crossref PubMed Google Scholar
2. Ji M , Ryu HJ , Hong JH . Signalling and putative therapeutic molecules on the regulation of synoviocyte signalling in rheumatoid arthritis . Bone Joint Res . 2021 ; 10 ( 4 ): 285 – 297 . Crossref PubMed Google Scholar
3. Li X , Yang Y , Sun G , et al. Promising targets and drugs in rheumatoid arthritis: a module-based and cumulatively scoring approach . Bone Joint Res . 2020 ; 9 ( 8 ): 501 – 514 . Crossref PubMed Google Scholar
4. Chou T-F , Ma H-H , Wang J-H , et al. Total elbow arthroplasty in patients with rheumatoid arthritis . Bone Joint J . 2020 ; 102-B ( 8 ): 967 – 980 . Crossref PubMed Google Scholar
5. Rodríguez-Elías AK , Maldonado-Murillo K , López-Mendoza LF , Ramírez-Bello J . Genetics and genomics in rheumatoid arthritis (RA): an update . Gac Med Mex . 2016 ; 152 ( 2 ): 218 – 227 . Google Scholar
6. Dehghan A . Genome-wide association studies . Methods Mol Biol . 2018 ; 1793 : 37 – 49 . Crossref PubMed Google Scholar
7. Symmons DP , Bankhead CR , Harrison BJ , et al. Blood transfusion, smoking, and obesity as risk factors for the development of rheumatoid arthritis: results from a primary care-based incident case-control study in Norfolk, England . Arthritis Rheum . 1997 ; 40 ( 11 ): 1955 – 1961 . Crossref PubMed Google Scholar
8. Seror R , Henry J , Gusto G , Aubin HJ , Boutron-Ruault MC , Mariette X . Passive smoking in childhood increases the risk of developing rheumatoid arthritis . Rheumatology . 2019 ; 58 ( 7 ): 1154 – 1162 . Crossref PubMed Google Scholar
9. Smolen JS , Aletaha D , Barton A , et al. Rheumatoid arthritis . Nat Rev Dis Primers . 2018 ; 4 : 18001 . Crossref PubMed Google Scholar
10. Sun BB , Maranville JC , Peters JE , et al. Genomic atlas of the human plasma proteome . Nature . 2018 ; 558 ( 7708 ): 73 – 79 . Crossref PubMed Google Scholar
11. Nys G , Cobraiville G , Servais A-C , Malaise MG , de Seny D , Fillet M . Targeted proteomics reveals serum amyloid A variants and alarmins S100A8-S100A9 as key plasma biomarkers of rheumatoid arthritis . Talanta . 2019 ; 204 : 507 – 517 . Crossref PubMed Google Scholar
12. Anderson NL . The clinical plasma proteome: a survey of clinical assays for proteins in plasma and serum . Clin Chem . 2010 ; 56 ( 2 ): 177 – 185 . Crossref PubMed Google Scholar
13. Akhbari P , Karamchandani U , Jaggard MKJ , et al. Can joint fluid metabolic profiling (or “metabonomics”) reveal biomarkers for osteoarthritis and inflammatory joint disease?: A systematic review . Bone Joint Res . 2020 ; 9 ( 3 ): 108 – 119 . Google Scholar
14. Bulik-Sullivan BK , Loh P-R , Finucane HK , et al. LD Score regression distinguishes confounding from polygenicity in genome-wide association studies . Nat Genet . 2015 ; 47 ( 3 ): 291 – 295 . Crossref PubMed Google Scholar
15. Burgess S , Butterworth A , Thompson SG . Mendelian randomization analysis with multiple genetic variants using summarized data . Genet Epidemiol . 2013 ; 37 ( 7 ): 658 – 665 . Crossref PubMed Google Scholar
16. Kappelmann N , Arloth J , Georgakis MK , et al. Dissecting the association between inflammation, metabolic dysregulation, and specific depressive symptoms: a genetic correlation and 2-sample mendelian randomization study . JAMA Psychiatry . 2021 ; 78 ( 2 ): 161 – 170 . Crossref PubMed Google Scholar
17. Okada Y , Wu D , Trynka G , et al. Genetics of rheumatoid arthritis contributes to biology and drug discovery . Nature . 2014 ; 506 ( 7488 ): 376 – 381 . Crossref PubMed Google Scholar
18. Di Angelantonio E , Thompson SG , Kaptoge S , et al. Efficiency and safety of varying the frequency of whole blood donation (INTERVAL): a randomised trial of 45 000 donors . Lancet . 2017 ; 390 ( 10110 ): 2360 – 2371 . Crossref PubMed Google Scholar
19. Lee JJ , McGue M , Iacono WG , Chow CC . The accuracy of LD score regression as an estimator of confounding and genetic correlations in genome-wide association studies . Genet Epidemiol . 2018 ; 42 ( 8 ): 783 – 795 . Crossref PubMed Google Scholar
20. Emdin CA , Khera AV , Kathiresan S . Mendelian randomization . JAMA . 2017 ; 318 ( 19 ): 1925 – 1926 . Crossref PubMed Google Scholar
21. Sekula P , Del Greco M F , Pattaro C , Köttgen A . Mendelian Randomization as an Approach to Assess Causality Using Observational Data . J Am Soc Nephrol . 2016 ; 27 ( 11 ): 3253 – 3265 . Crossref PubMed Google Scholar
22. No authors listed . MR-Base. University of Bristol . 2020 . http://app.mrbase.org/ ( date last accessed 15 February 2022 ). Google Scholar
23. No authors listed . Gene Expression Omnibus. National Center for Biotechnology Information . 2022 . https://www.ncbi.nlm.nih.gov/geo/ ( date last accessed 15 February 2022 ). Google Scholar
24. Clough E , Barrett T . The gene expression omnibus database . Methods Mol Biol . 2016 ; 1418 : 93 – 110 . Google Scholar
25. Ye H , Zhang J , Wang J , et al. CD4 T-cell transcriptome analysis reveals aberrant regulation of STAT3 and Wnt signaling pathways in rheumatoid arthritis: evidence from a case-control study . Arthritis Res Ther . 2015 ; 17 : 76 . Crossref PubMed Google Scholar
26. No authors listed . GEO2R. Gene Expression Omnibus (GEO) - NCBI . 2022 . https://www.ncbi.nlm.nih.gov/geo/geo2r/ ( date last accessed 16 February 2022 ). Google Scholar
27. Schmidt AM , Yan SD , Yan SF , Stern DM . The biology of the receptor for advanced glycation end products and its ligands . Biochim Biophys Acta . 2000 ; 1498 ( 2–3 ): 99 – 111 . Crossref PubMed Google Scholar
28. Pullerits R , Bokarewa M , Dahlberg L , Tarkowski A . Decreased levels of soluble receptor for advanced glycation end products in patients with rheumatoid arthritis indicating deficient inflammatory control . Arthritis Res Ther . 2005 ; 7 ( 4 ): R817 - 24 . Crossref PubMed Google Scholar
29. Kim S-J , Hyeong Lee T , Hee Nam S , et al. Association of Uba6-specific-E2 (USE1) with lung tumorigenesis . J Natl Cancer Inst . 2017 ; 109 ( 3 ): 1 – 11 . Crossref PubMed Google Scholar
30. Leffler EM , Band G , Busby GBJ , et al. Resistance to malaria through structural variation of red blood cell invasion receptors . Science . 2017 ; 356 ( 6343 ): eaam6393 . Crossref PubMed Google Scholar
31. Louzada S , Algady W , Weyell E , et al. Structural variation of the malaria-associated human glycophorin A-B-E region . BMC Genomics . 2020 ; 21 ( 1 ): 446 . Crossref PubMed Google Scholar
32. Sánchez G , Aragonès L , Costafreda MI , Ribes E , Bosch A , Pintó RM . Capsid region involved in hepatitis A virus binding to glycophorin A of the erythrocyte membrane . J Virol . 2004 ; 78 ( 18 ): 9807 – 9813 . Crossref PubMed Google Scholar
33. Curjuric I , Imboden M , Nadif R , et al. Different genes interact with particulate matter and tobacco smoke exposure in affecting lung function decline in the general population . PLoS One . 2012 ; 7 ( 7 ): e40175 . Crossref PubMed Google Scholar
34. Lecht S , Chiaverelli RA , Gerstenhaber J , et al. Anti-angiogenic activities of snake venom CRISP isolated from Echis carinatus sochureki . Biochim Biophys Acta . 2015 ; 1850 ( 6 ): 1169 – 1179 . Crossref PubMed Google Scholar
35. Xie Z , Askari A . Na(+)/K(+)-ATPase as a signal transducer . Eur J Biochem . 2002 ; 269 ( 10 ): 2434 – 2439 . Crossref PubMed Google Scholar
36. Wang H , Haas M , Liang M , et al. Ouabain assembles signaling cascades through the caveolar Na+/K+-ATPase . J Biol Chem . 2004 ; 279 ( 17 ): 17250 – 17259 . Crossref PubMed Google Scholar
37. Batiuk MY , de Vin F , Duqué SI , et al. An immunoaffinity-based method for isolating ultrapure adult astrocytes based on ATP1B2 targeting by the ACSA-2 antibody . J Biol Chem . 2017 ; 292 ( 21 ): 8874 – 8891 . Crossref PubMed Google Scholar
38. Pablos JL , Santiago B , Tsay D , et al. A HEV-restricted sulfotransferase is expressed in rheumatoid arthritis synovium and is induced by lymphotoxin-alpha/beta and TNF-alpha in cultured endothelial cells . BMC Immunol . 2005 ; 6 : 6 . Crossref PubMed Google Scholar
Author contributions
P. Luo: Conceptualization, Methodology, Investigation, Formal analysis, Writing – original draft, Writing – review & editing.
S. Cheng: Project administration, Writing – original draft, Writing – review & editing.
F. Zhang: Resources, Writing – review & editing.
R. Feng: Resources, Project administration, Writing – review & editing.
K. Xu: Formal analysis, Writing – review & editing.
W. Jing: Investigation.
P. Xu: Conceptualization.
Funding statement
The author(s) disclose receipt of the following financial or material support for the research, authorship, and/or publication of this article: funding support from the National Natural Science Foundation of China (82072432, 81772410).
ICMJE COI statement
The authors declare that they have no competing interests.
Data sharing
Publicly available datasets were analyzed in this study. These data can be found here: The genome-wide association studies (GWAS) summary data of human plasma proteome.
Data availability: Participant-level genotype and protein data, and full summary association results from the genetic analysis, are available through the European Genotype Archive (accession number EGAS00001002555).
Summary association results are also publicly available at: http://www.phpc.cam.ac.uk/ceu/proteins/.
The GWAS summary data of rheumatoid arthritis (RA): http://plaza.umin.ac.jp/~yokada/datasource/files/GWASMetaResults/RA_GWASmeta_European_v2.txt.gz.
Acknowledgements
Not applicable.
Ethical review statement
Not applicable.
Open access funding
The authors report that the open access funding for their manuscript was self-funded.
© 2022 Author(s) et al. This is an open-access article distributed under the terms of the Creative Commons Attribution Non-Commercial No Derivatives (CC BY-NC-ND 4.0) licence, which permits the copying and redistribution of the work only, and provided the original author and source are credited. See https://creativecommons.org/licenses/by-nc-nd/4.0/.
