


Abstract
Aims
The distal radius is a major site of osteoporotic bone loss resulting in a high risk of fragility fracture. This study evaluated the capability of a cortical index (CI) at the distal radius to predict the local bone mineral density (BMD).
Methods
A total of 54 human cadaver forearms (ten singles, 22 pairs) (19 to 90 years) were systematically assessed by clinical radiograph (XR), dual-energy X-ray absorptiometry (DXA), CT, as well as high-resolution peripheral quantitative CT (HR-pQCT). Cortical bone thickness (CBT) of the distal radius was measured on XR and CT scans, and two cortical indices mean average (CBTavg) and gauge (CBTg) were determined. These cortical indices were compared to the BMD of the distal radius determined by DXA (areal BMD (aBMD)) and HR-pQCT (volumetric BMD (vBMD)). Pearson correlation coefficient (r) and intraclass correlation coefficient (ICC) were used to compare the results and degree of reliability.
Results
The CBT could accurately be determined on XRs and highly correlated to those determined on CT scans (r = 0.87 to 0.93). The CBTavg index of the XRs significantly correlated with the BMD measured by DXA (r = 0.78) and HR-pQCT (r = 0.63), as did the CBTg index with the DXA (r = 0.55) and HR-pQCT (r = 0.64) (all p < 0.001). A high correlation of the BMD and CBT was observed between paired specimens (r = 0.79 to 0.96). The intra- and inter-rater reliability was excellent (ICC 0.79 to 0.92).
Conclusion
The cortical index (CBTavg) at the distal radius shows a close correlation to the local BMD. It thus can serve as an initial screening tool to estimate the local bone quality if quantitative BMD measurements are unavailable, and enhance decision-making in acute settings on fracture management or further osteoporosis screening.
Cite this article: Bone Joint Res 2021;10(12):820–829.
Article focus
-
Assessment of local bone mineral density (BMD) with standard radiographs (XRs) if quantitative measurements (dual-energy X-ray absorptiometry (DXA), high-resolution peripheral quantitative CT (HR-pQCT)) are not available.
Key messages
-
The mean average cortical bone thickness (CBTavg) allows prediction of the local BMD.
-
The CBTavg of the distal radius can reliably be determined from standard XRs.
-
The contralateral distal radius can serve as a reliable reference.
Strengths and limitations
-
The study included local quantitative BMD measurements (DXA, HR-pQCT) of the upper limb in a representative collective.
-
Validation by CT as well as intra- and interobserver reliability.
-
Cortical bone thickness and BMD of the radius were not correlated with the in vivo fracture risk.
Introduction
Osteoporosis is a multifactorial skeletal disorder which is associated with an impaired bone quality and causes about 9.0 million fragility fractures a year.1 The epidemiology is complex and includes genetic, environmental, and metabolic factors.2-4 Osteoporotic fractures are usually caused by low-energy trauma and occur at the trabecula or metaphyseal bone region,5 with the distal radius being one of the most affected sites.6
Dual-energy X-ray absorptiometry (DXA) and peripheral quantitative CT (pQCT) are the most common methods to assess quantitative bone mineral density (BMD). Unfortunately, these diagnostic tools are not ubiquitous7,8 and are rarely available in acute care settings for treating osteoporotic fractures. However, the choice of conservative or operative therapy is not only based on age or fracture pattern, but is also influenced by the local bone quality.9 Poor bone stock is associated with an increased risk for complications such as failure of fixation, secondary dislocation, and malunion,9,10 and therefore it is essential to include an initial appraisal of the patient’s bone quality.
Recently, readily available sources were evaluated to assess the BMD as an initial screening tool. Pulse-echo ultrasonometry measuring the cortical thickness has been shown to be a reliable screening test for hip osteoporosis,11 and a promising tool to identify subjects at risk for a low BMD.12 Besides, several simple radiological evaluation techniques have been proposed to predict the local bone quality, with the CBT on standard radiographs (XRs) showing promising results for the humerus, femur, and tibia.13-19 For the humerus, a good correlation between a cortical index (CI) and BMD was reported by several studies17,18,20 and found to be an inexpensive method to rule out osteoporosis.20 Moreover, a direct correlation of the CBT with the ultimate fracture load could be demonstrated.21 For the distal radius, only two studies described a correlation of the cortical thickness to the BMD, but were either limited by comparing the radial cortical thickness to the femoral and lumbar BMD or only assessed a sample size of six donors.22,23
Therefore, this study evaluated the correlation between CBT and the quantitative BMD of the distal radius. We hypothesized that the CBT can accurately be determined on clinical XRs with a standardized method, and that a clinical applicable CI at the distal radius correlates with the BMD determined by DXA (areal BMD (aBMD)) and high-resolution peripheral quantitative CT (HR-pQCT) (volumetric BMD (vBMD)).
Methods
Specimens
A total of 54 distal radial forearms (ten singles, 22 pairs) from human cadaveric specimens (fresh frozen at −20°C) were evaluated. Specimens were acquired from International Institute for the Advancement of Medicine (IIAM; USA), with appropriate written consent of the donors during their lifetime or their next of kin post-mortem. The cadavers were shipped fresh frozen to the research institute and all post-mortem procedures were performed in accordance with the highest ethical standards. The study was approved by the institutional research board of AO Research Institute Davos (ARI). The specimens, including the soft tissue, were scanned at room temperature by different imaging methods (XR, DXA, CT, and HR-pQCT). Prior to analysis, the XR and CT scans were evaluated to exclude unreported bony alterations of the distal forearm.
Imaging of the specimens
Standard radiographs: Biplanar digital XRs of the forearms were captured with a standard clinical XR tube (Siemens AG, Germany). A radiography step wedge was added to all images to allow subsequent calibration. XRs were performed in the standard posteroanterior (p.a.) and lateral views, with the p.a. view used for analysis.
CT scans were performed on a standard clinical multislice CT scanner (Siemens SOMATOM Sensation 64; Siemens AG, Germany). The Siemens phantom was regularly scanned for quality control. All forearms were put in the neutral position and were scanned with an image resolution of 512 × 512 pixels, an overlapping slice thickness of 600 µm and the H90 kernel resulting in an image volume element (voxel) of 0.6 × 0.6 × 0.4 mm3. Evaluation was performed on cross-sectional views of the forearm that can be viewed in a sequence.
Bone mineral density measurements
DXA: Dual-energy XR absorptiometry was performed at the distal forearm with a standard DXA scanner (General Electrics Lunar Prodigy; GE Healthcare, UK) to determine the aBMD (g/cm2). Measurements were executed according to the manufacturer’s instructions with the clinical standard protocol. The complete forearm including soft tissue was placed on the scanning table mimicking a sitting position next to the scanner with the palm facing downwards. The length of the forearm was determined and the arm was fixed with velcro straps on the positioner aligned with the long axis of the scanner. After scanning, the reference line was placed at the distal tip of the ulna styloid process and the ultra-distal line was set at the bifurcation of the radius and ulna, not containing the radial endplate. For the radial aBMD, the ultra-distal region (radius UD) and one-third distal region (radius 33%) were chosen in order to account for cortical and trabecular bone (Figure 1).
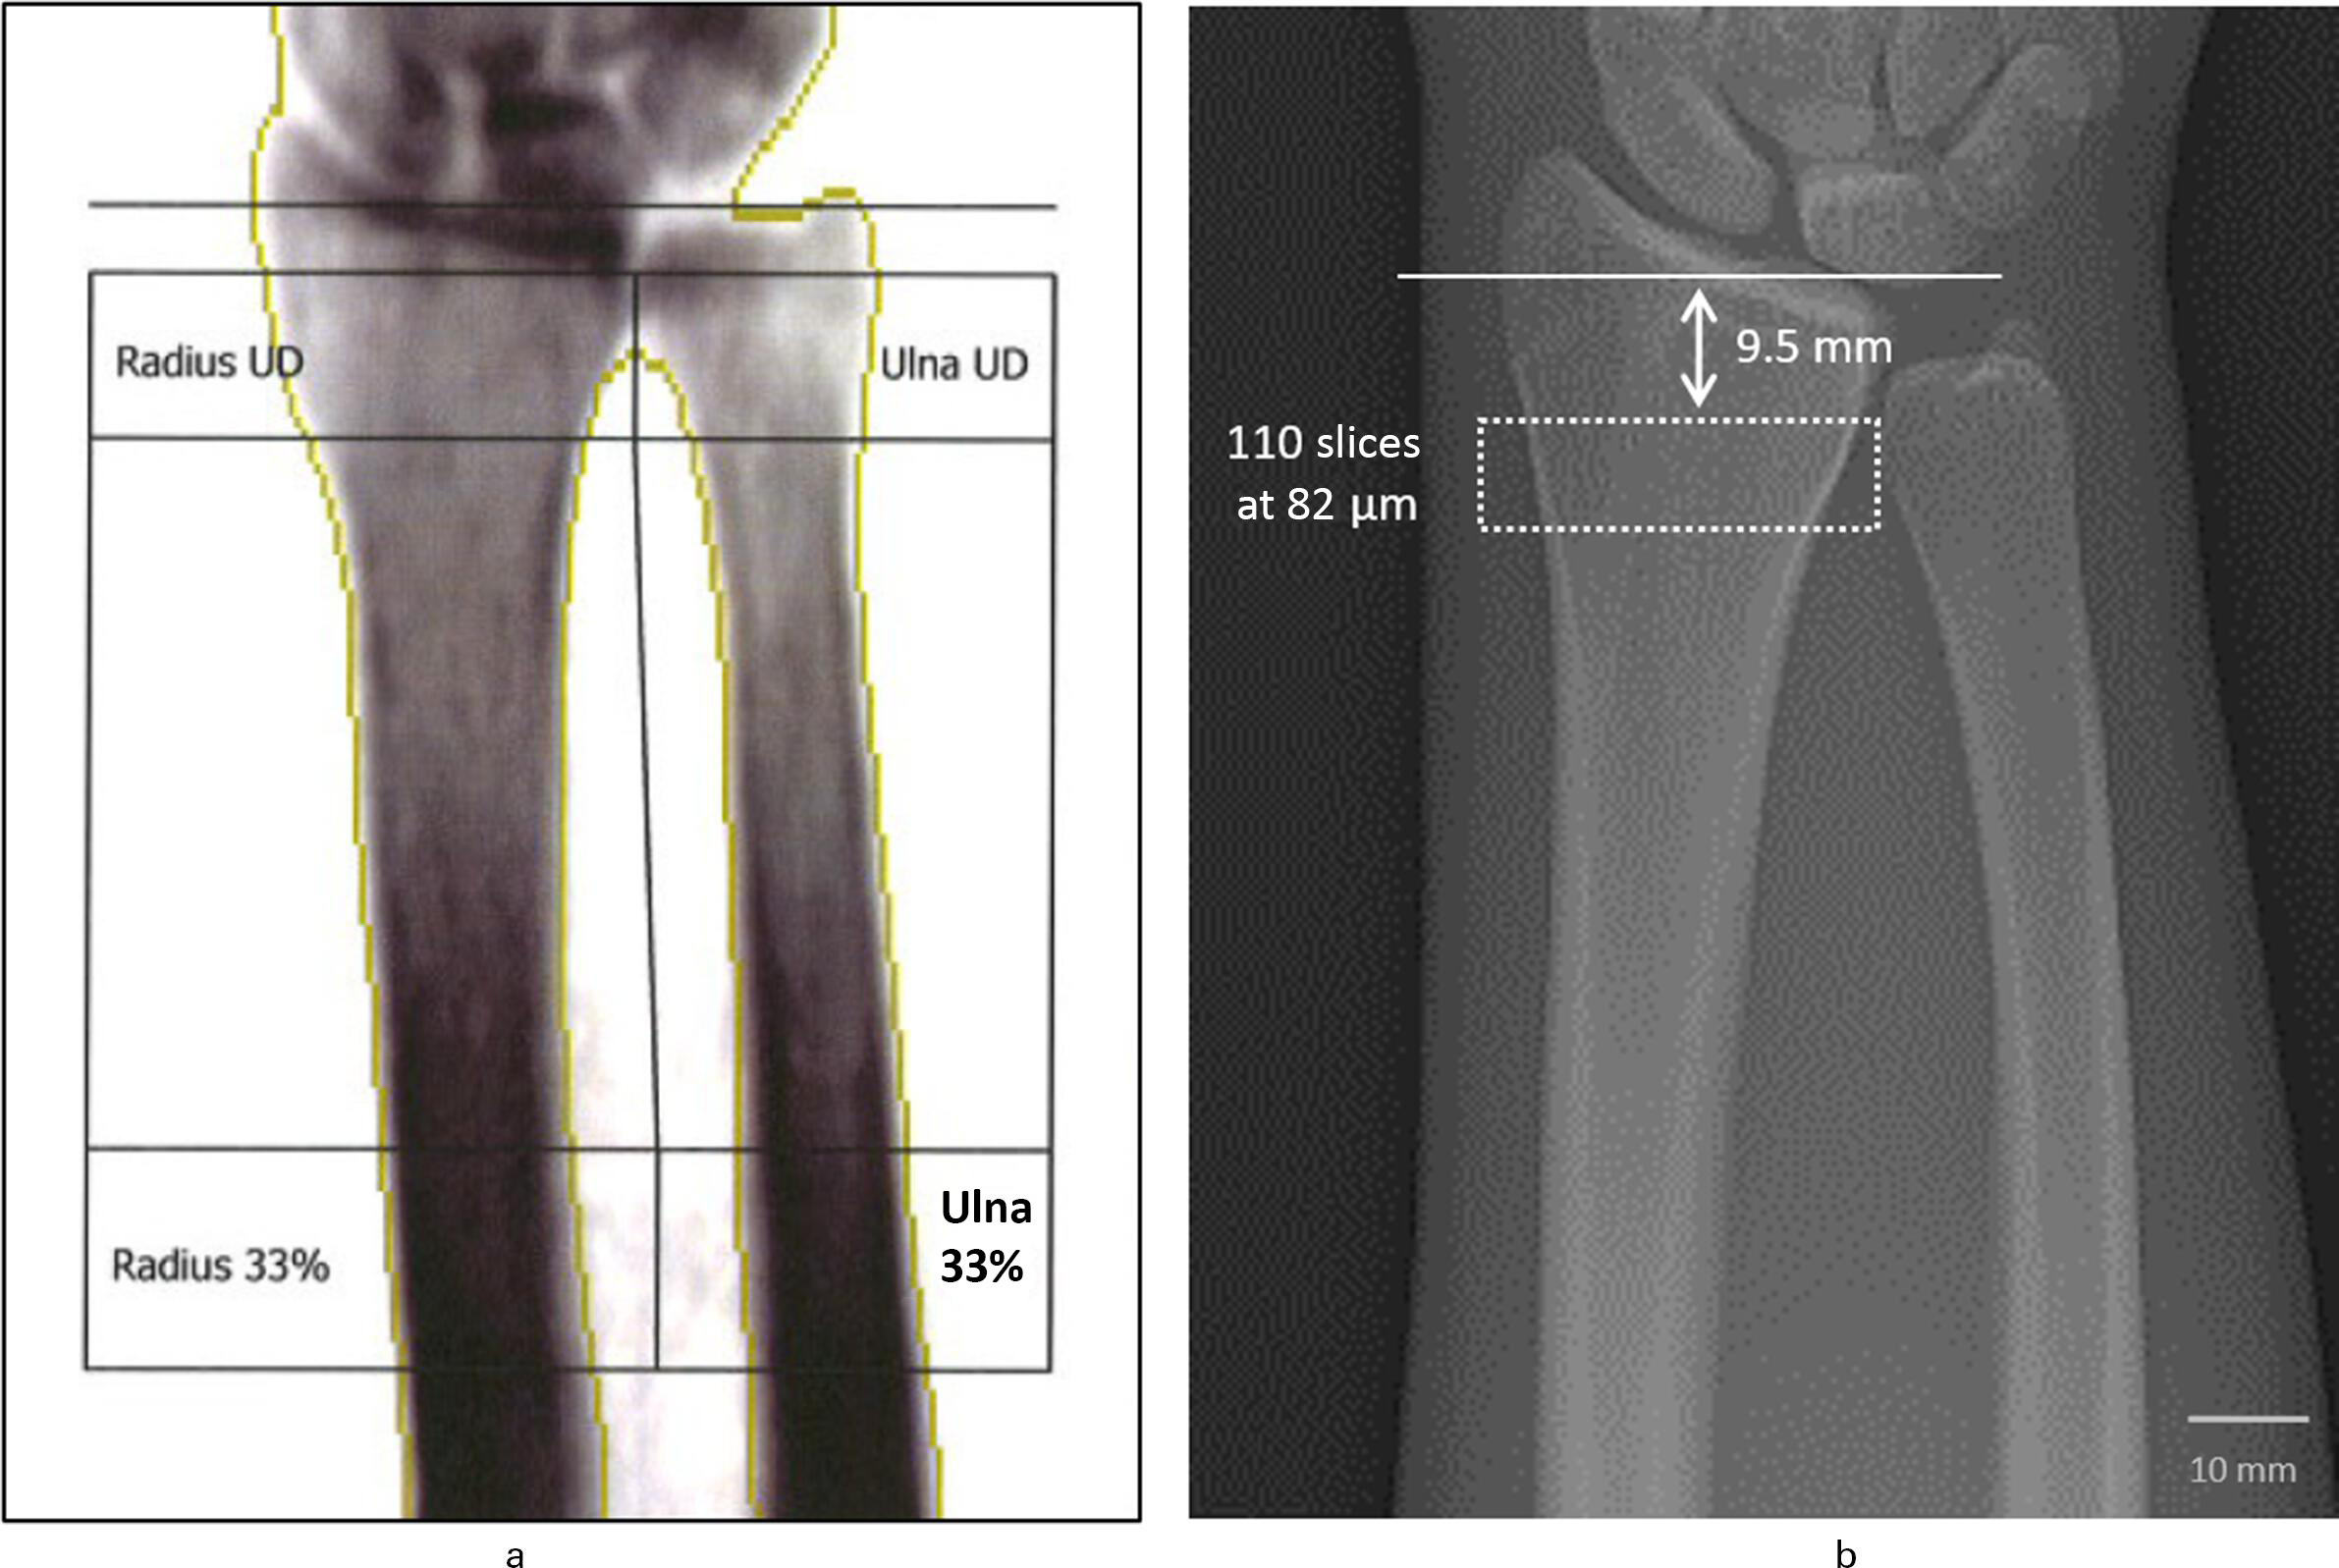
Fig. 1
Scanning region at the distal radius for measurement of the quantitative bone mineral density (BMD). a) Dual-energy X-ray absorptiometry (DXA) measuring the areal BMD (aBMD) (g/cm2) of the radius. For the radial aBMD, the ultra-distal region (radius UD) and one-third distal region (radius 33%) were included. b) High-resolution peripheral quantitative CT (HR-pQCT) (resolution of 82 µm) measuring the volumetric BMD (vBMD) (mgHA/cm3) of the radius. The scanning region includes 110 slices with a nominal voxel size of 82 µm starting 9.5 mm from the inflection point of the distal radius endplate.
HR-pQCT: HR-pQCT was performed with a standard HR-pQCT (XtremeCT; Scanco Medical, Switzerland) to determine the vBMD (mgHA/cm3). The HR-pQCT is equipped with a 70-lm focal spot, the XR tube was set at 60 kVp and 900 μA, and the image matrix size was 1,536 × 1,536 at nominal 82 µm isotropic resolution. The integration time was set to 300 milliseconds. The Scanco phantom was scanned daily for quality control.
The forearm was fixed in the centre of a carbon fibre shell and the dorsal side was facing upwards. Scanning and analysis of the distal forearm was performed by using the software package provided by the scanner manufacturer (Image Processing Language; Scanco Medical). After running the scout view, a reference line was placed at the inflection point on the endplate of the distal radius with the scan region starting 9.5 mm proximally. The vBMD was determined via a protocol as described by Laib et al,24 using a standardized stack of 110 parallel CT slices with an isotropic voxel size of 82 µm (approximately 9 mm) (Figure 1).
Cortical bone thickness measurement
CBTavg from XR: Mean average cortical bone thickness (CBTavg) was determined according to the method described by Tingart et al18 and Mather et al20 for the proximal humerus. The method has been reported to allow an excellent intra- and interobserver reliability.18,20 Evaluation of the XRs and CT scans was performed in a random order by two observers (CS and SGY) who were blinded to the BMD results and the specimens. In order to assess the inter- and intraobserver reliability, all measurements were performed by each observer at two different times with an interval of at least two weeks.
The combined CBT of the medial and lateral distal radius was measured at two different levels (Figure 2). The first level (M1) was the point where the outer medial and lateral cortical borders were parallel to each other. The second level was obtained 20 mm distal to the first level (M3). A perpendicular line was drawn from the medial outer cortex to the lateral outer cortex and measured by a digital caliper (Synedra View Personal 3.4.0.2; synedra IT GmbH, Austria) with a precision of ± 0.1 mm. The width of the intramedullary canal was measured at the same levels (M2, M4). Then, the M2 distance was subtracted from the M1 distance to get the combined CBT at level one, and the second level was calculated accordingly. CBTavg was calculated as the mean of combined thickness at the two levels ((M1-M2 + M3-M4)/2).
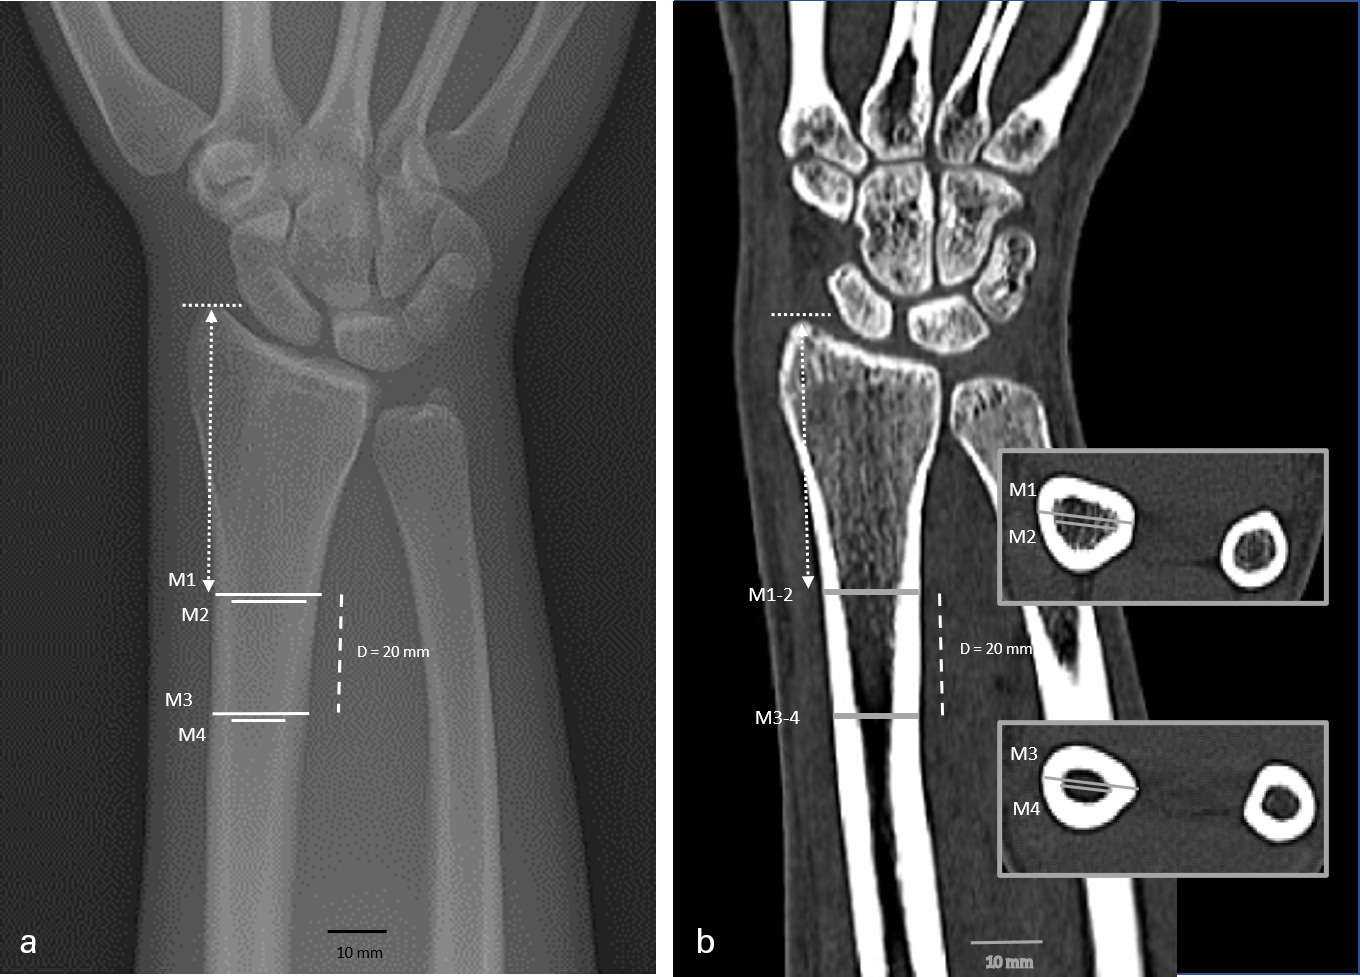
Fig. 2
Cortical bone thickness (CBT) measurement in a 46-year-old male: a) standard anteroposterior radiograph (XR) and b) clinical CT in coronal plane. CBT was determined on two levels (M1/M2 and M3/M4) with a distance of 20 mm (dashed line). The identical height in XR and CT was ensured by transferring the length from the styloid to the first level (scattered lines).
The differences in cortical thickness and the resulting CBTavg index are demonstrated in Figure 3. Direct comparison of two specimens, one with low and one with high BMD, reveals a clear difference in the cortical thickness resulting in a highly different CBTavg index. The cortical affection by the bone substance loss is further underlined by the corresponding HR-pQCT sections, showing a circumferential cortical reduction at the specimen with a low BMD.
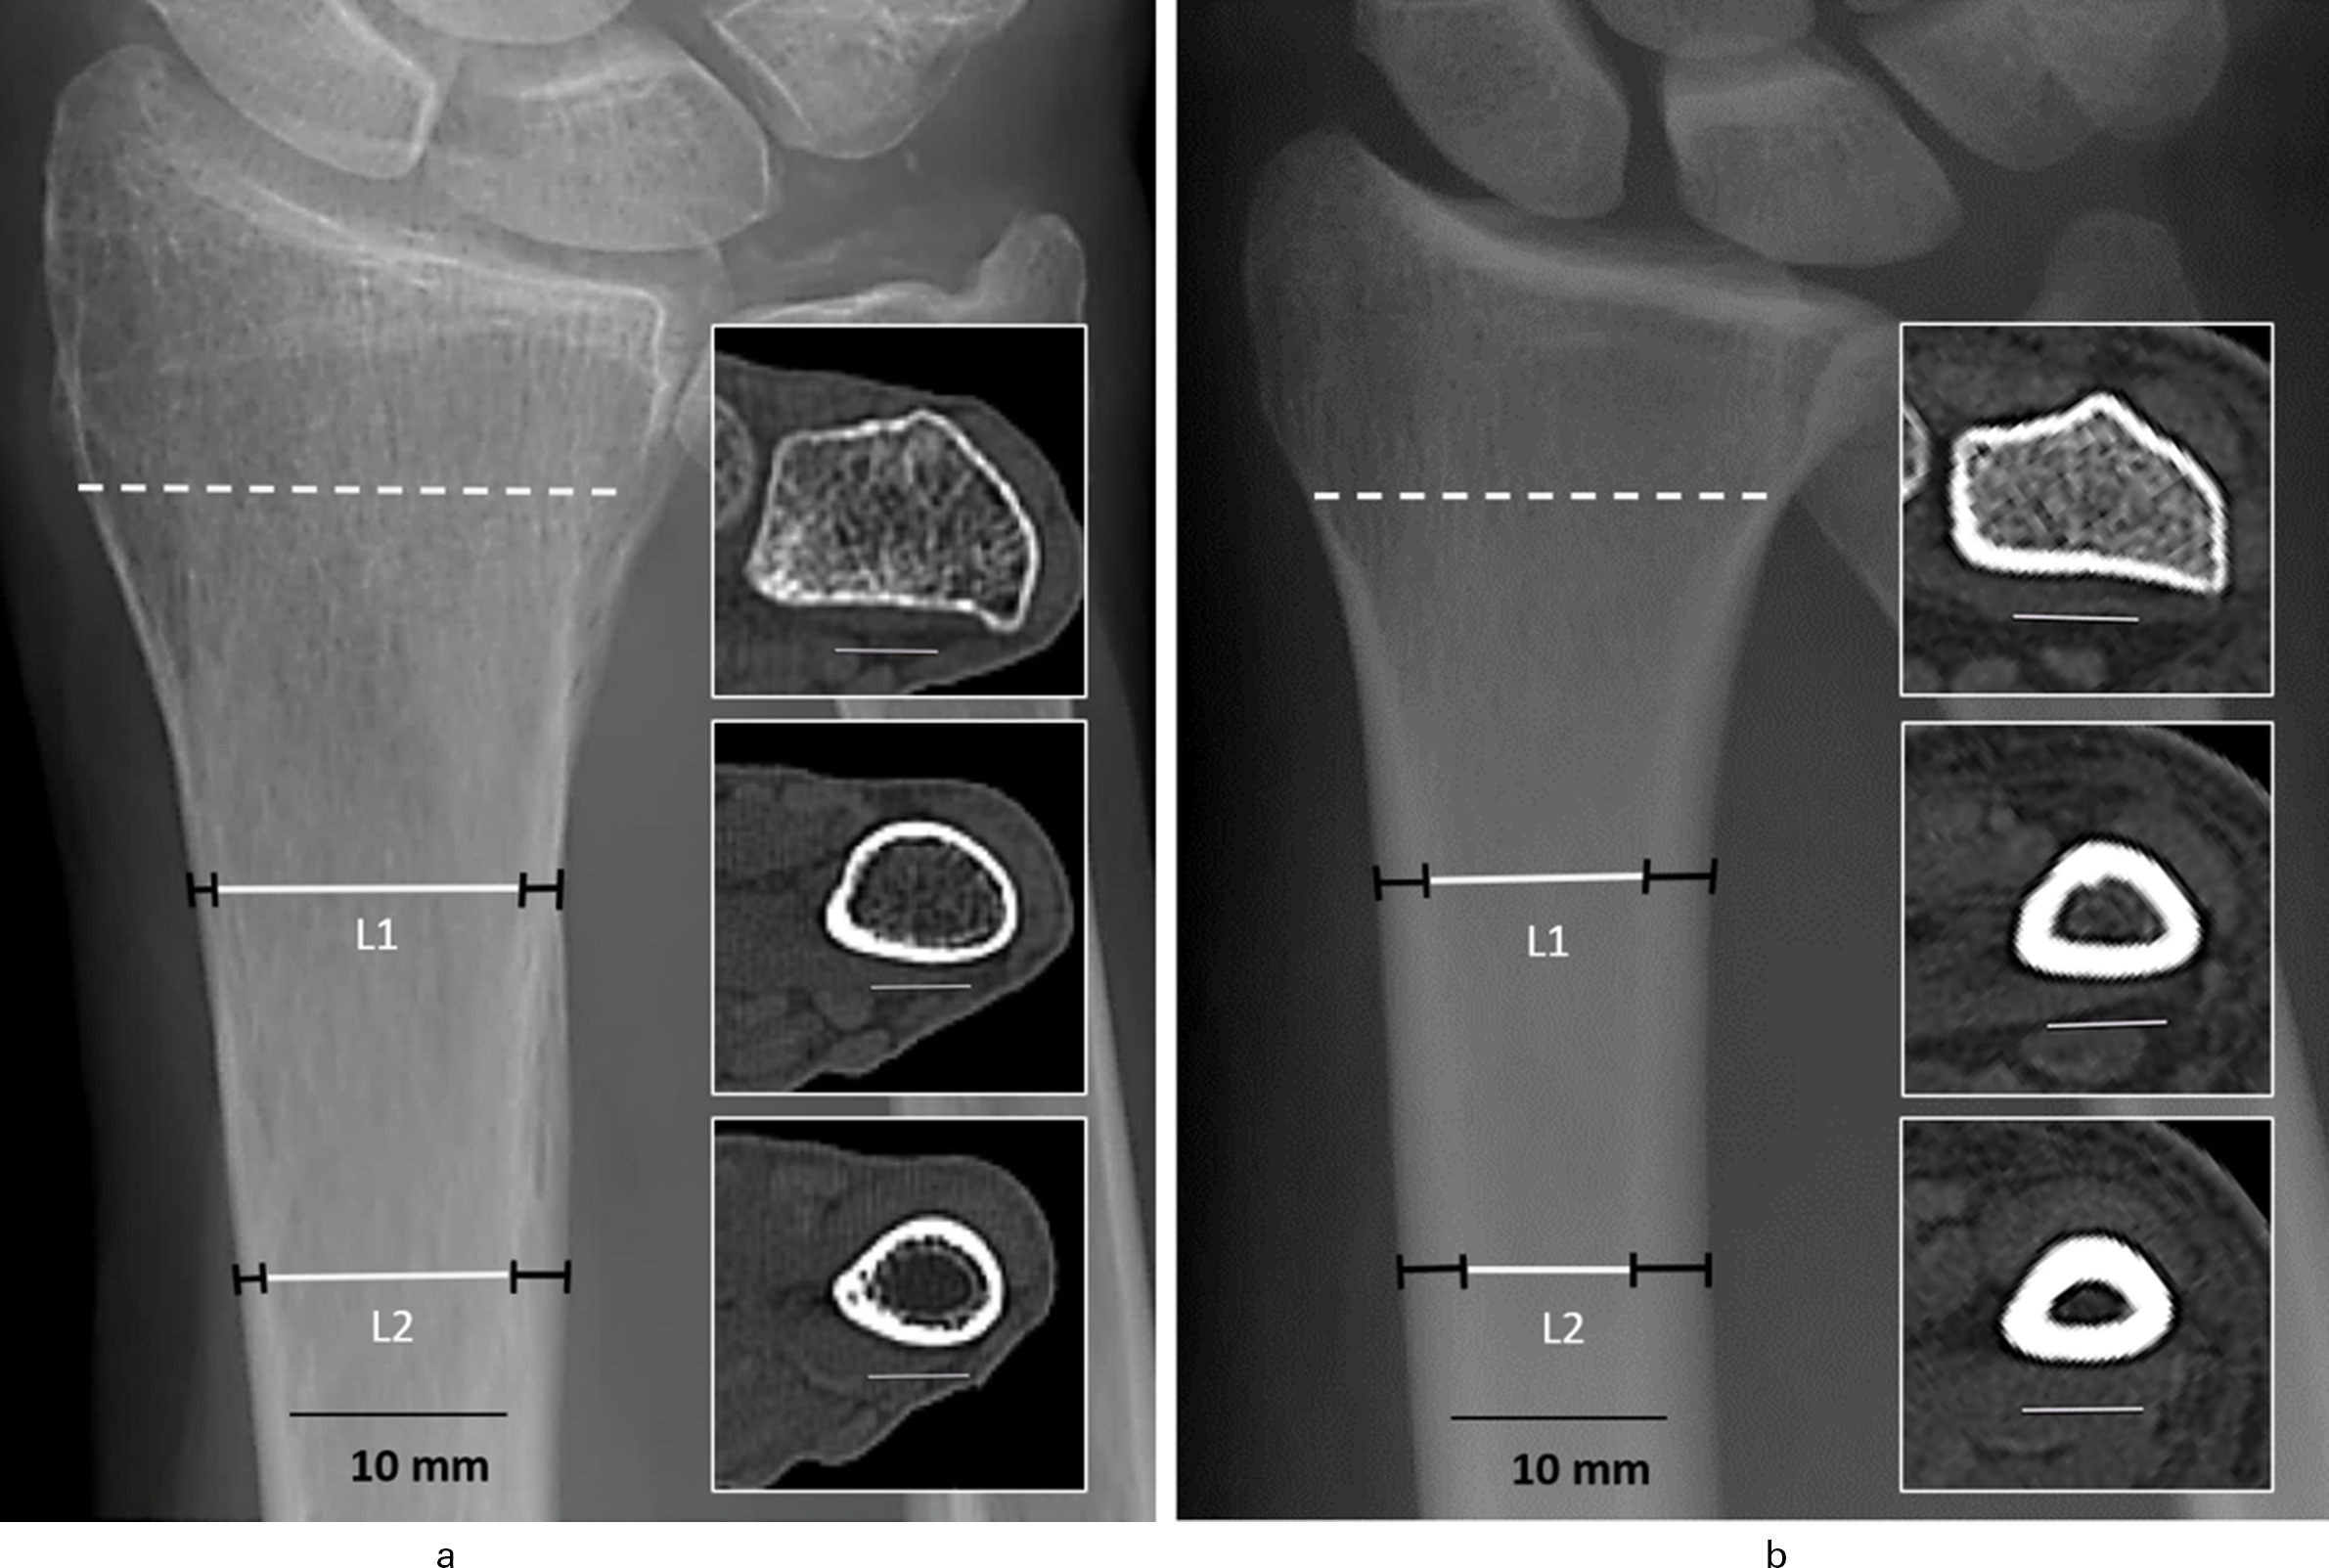
Fig. 3
Cortical bone thickness (CBT) in standard anteroposterior radiographs of two radius samples with a) low areal bone mineral density (aBMD) (0.37 g/cm2) (female, 89 years old) and b) high aBMD (0.67 g/cm2) (male, 32 years old). Apparent difference in the CBT with a mean average CBT (CBTavg) of 3.95 mm (a) versus 6.65 mm (b). CBT visualized in a high-resolution peripheral quantitative CT (HR-pQCT) (volumetric bone mineral density (vBMD)) section (scattered line/insert) and at the CBT levels (L1 and L2 black bars = cortical thickness) with the corresponding CT sections (inserts).
CBTg from XR: Gauge cortical bone thickness (CBTg) was calculated as a second index and intends to account for any effect of the total bone diameter on the BMD measurements and also for magnification differences between the XRs in the daily routine. CBTg was determined as described by Hepp et al14 and Mather et al,20 dividing the CBTavg by the outer bone diameter of the proximal level (M1) (CBTavg/M1).
CBTavg and CBTg from CT: To assess the validity of the cortical measurements obtained from the XRs, CBTavg and CBTg were again determined from the CT scans. To account for the same level in the XR and CT measurements, a line perpendicular to the first level (M1) to the top of the radial styloid was depicted in the XR. This length was used to define the first measurement level in the CT analysis. The second level was then measured accordingly 20 mm distal of the first level (Figure 2 and Figure 3). Calculation of the CBTavg and CBTg was equally performed as described above.
Statistical analysis
Statistics were analyzed with SPSS v23.0 (IBM, USA) and graphs were created with Prism 8 (GraphPad Software, USA). Data for the CBT, BMD, and age are presented as means (standard deviation (SD); range). Results of the CBT represent the mean of the first measurements of the two raters, as the second is considered not completely independent.
Normality of data distribution was screened and confirmed by the Shapiro-Wilk test. Correlations were performed using two-tailed Pearson correlation coefficient and the outcomes were reported in terms of both r coefficient and p-value, to indicate the strength of the relationship between the measurements. Statistical significance was set at p < 0.05.
Intraclass correlation coefficients (ICCs) were calculated to assess intra- and inter-rater reliability of the CT-/CBTavg and CT-/CBTg measurements. ICCs greater than 0.75 were considered excellent, ICCs of 0.40 to 0.75 were considered to indicate moderate reliability, and ICCs of less than 0.40 were considered to indicate poor rater reliability.
Results
Characteristics of the specimens
For all 54 specimens (ten singles, 22 paired), the dominant hand side was unknown. Mean age of the 32 individuals (16 males, 16 females) was 65 years (SD 22; 19 to 90), mean height 168 cm (SD 12; 149 to 193), mean weight 79 kg (SD 19; 49 to 114), and a mean BMI of 28 kg/m2 (SD 8; 17 to 47).
The aBMD (DXA) and vBMD (HR-pQCT) measurements for the distal radius as well as the CBT results from the XR and CT scans are given in Table I. The aBMD (DXA) and vBMD (HR-pQCT) of the distal radius were highly consistent and correlated with r = 0.78 (p < 0.001) (Figure 4). Comparison between the left and right side of the 22 paired specimens revealed a high degree of correlation for the aBMD (r = 0.96) and vBMD (r = 0.93) (both p < 0.001, all Pearson correlation coefficient) (Figure 5).
Table I.
Bone mineral density and cortical bone thickness.
| Group | aBMD, g/cm2 (SD; range)* | vBMD, mgHA/cm3 (SD; range)* | XR CBTavg, mm (SD; range)† | XR CBTg, mm (SD; range)† | CT-CBTavg, mm (SD; range)† | CT-CBTg, mm (SD; range)† |
|---|---|---|---|---|---|---|
| Total (n = 54) |
0.49 (0.12; 0.24 to 0.75) | 271 (74; 111 to 386) | 5.19 (1.18; 2.95 to 7.25) | 0.31 (0.09; 0.16 to 0.51) | 5.35 (1.15; 3.20 to 7.65) | 0.34 (0.08; 0.19 to 0.54) |
| Single (n = 32)‡ |
0.48 (0.11; 0.24 to 0.70) | 265 (74; 111 to 386) | 5.05 (1.23; 2.95 to 7.18) | 0.30 (0.09; 0.16 to 0.49) | 5.30 (1.24; 3.20 to 7.53) | 0.33 (0.09; 0.19 to 0.54) |
| Right (n = 22)§ |
0.50 (0.12; 0.24 to 0.70) | 279 (79; 111 to 386) | 5.32 (1.16; 2.95 to 7.18) | 0.32 (0.08; 0.16 to 0.49) | 5.45 (1.15; 3.55 to 7.40) | 0.35 (0.09; 0.21 to 0.54) |
| Left (n = 22)§ |
0.51 (0.13; 0.32 to 0.62) | 279 (76; 139 to 384) | 5.40 (1.08; 3.15 to 7.25) | 0.33 (0.08; 0.17 to 0.51) | 5.43 (1.02; 3.33 to 7.65) | 0.35 (0.08; 0.19 to 0.54) |
-
*
Bone mineral density measured by dual-energy radiograph absorptiometry (areal BMD) and high-resolution peripheral quantitative CT (volumetric BMD).
-
†
Cortical bone thickness measured on radiographs and CT scans.
-
‡
Single (n = 32) consisting of one of the 22 paired and ten single specimens.
-
§
Left/right (n = 22) each side of the 22 paired specimens.
-
aBMD, areal bone mineral density; CBTavg, mean average cortical bone thickness; CBTg, gauge cortical bone thickness; SD, standard deviation; vBMD, volumetric BMD; XR, radiograph.
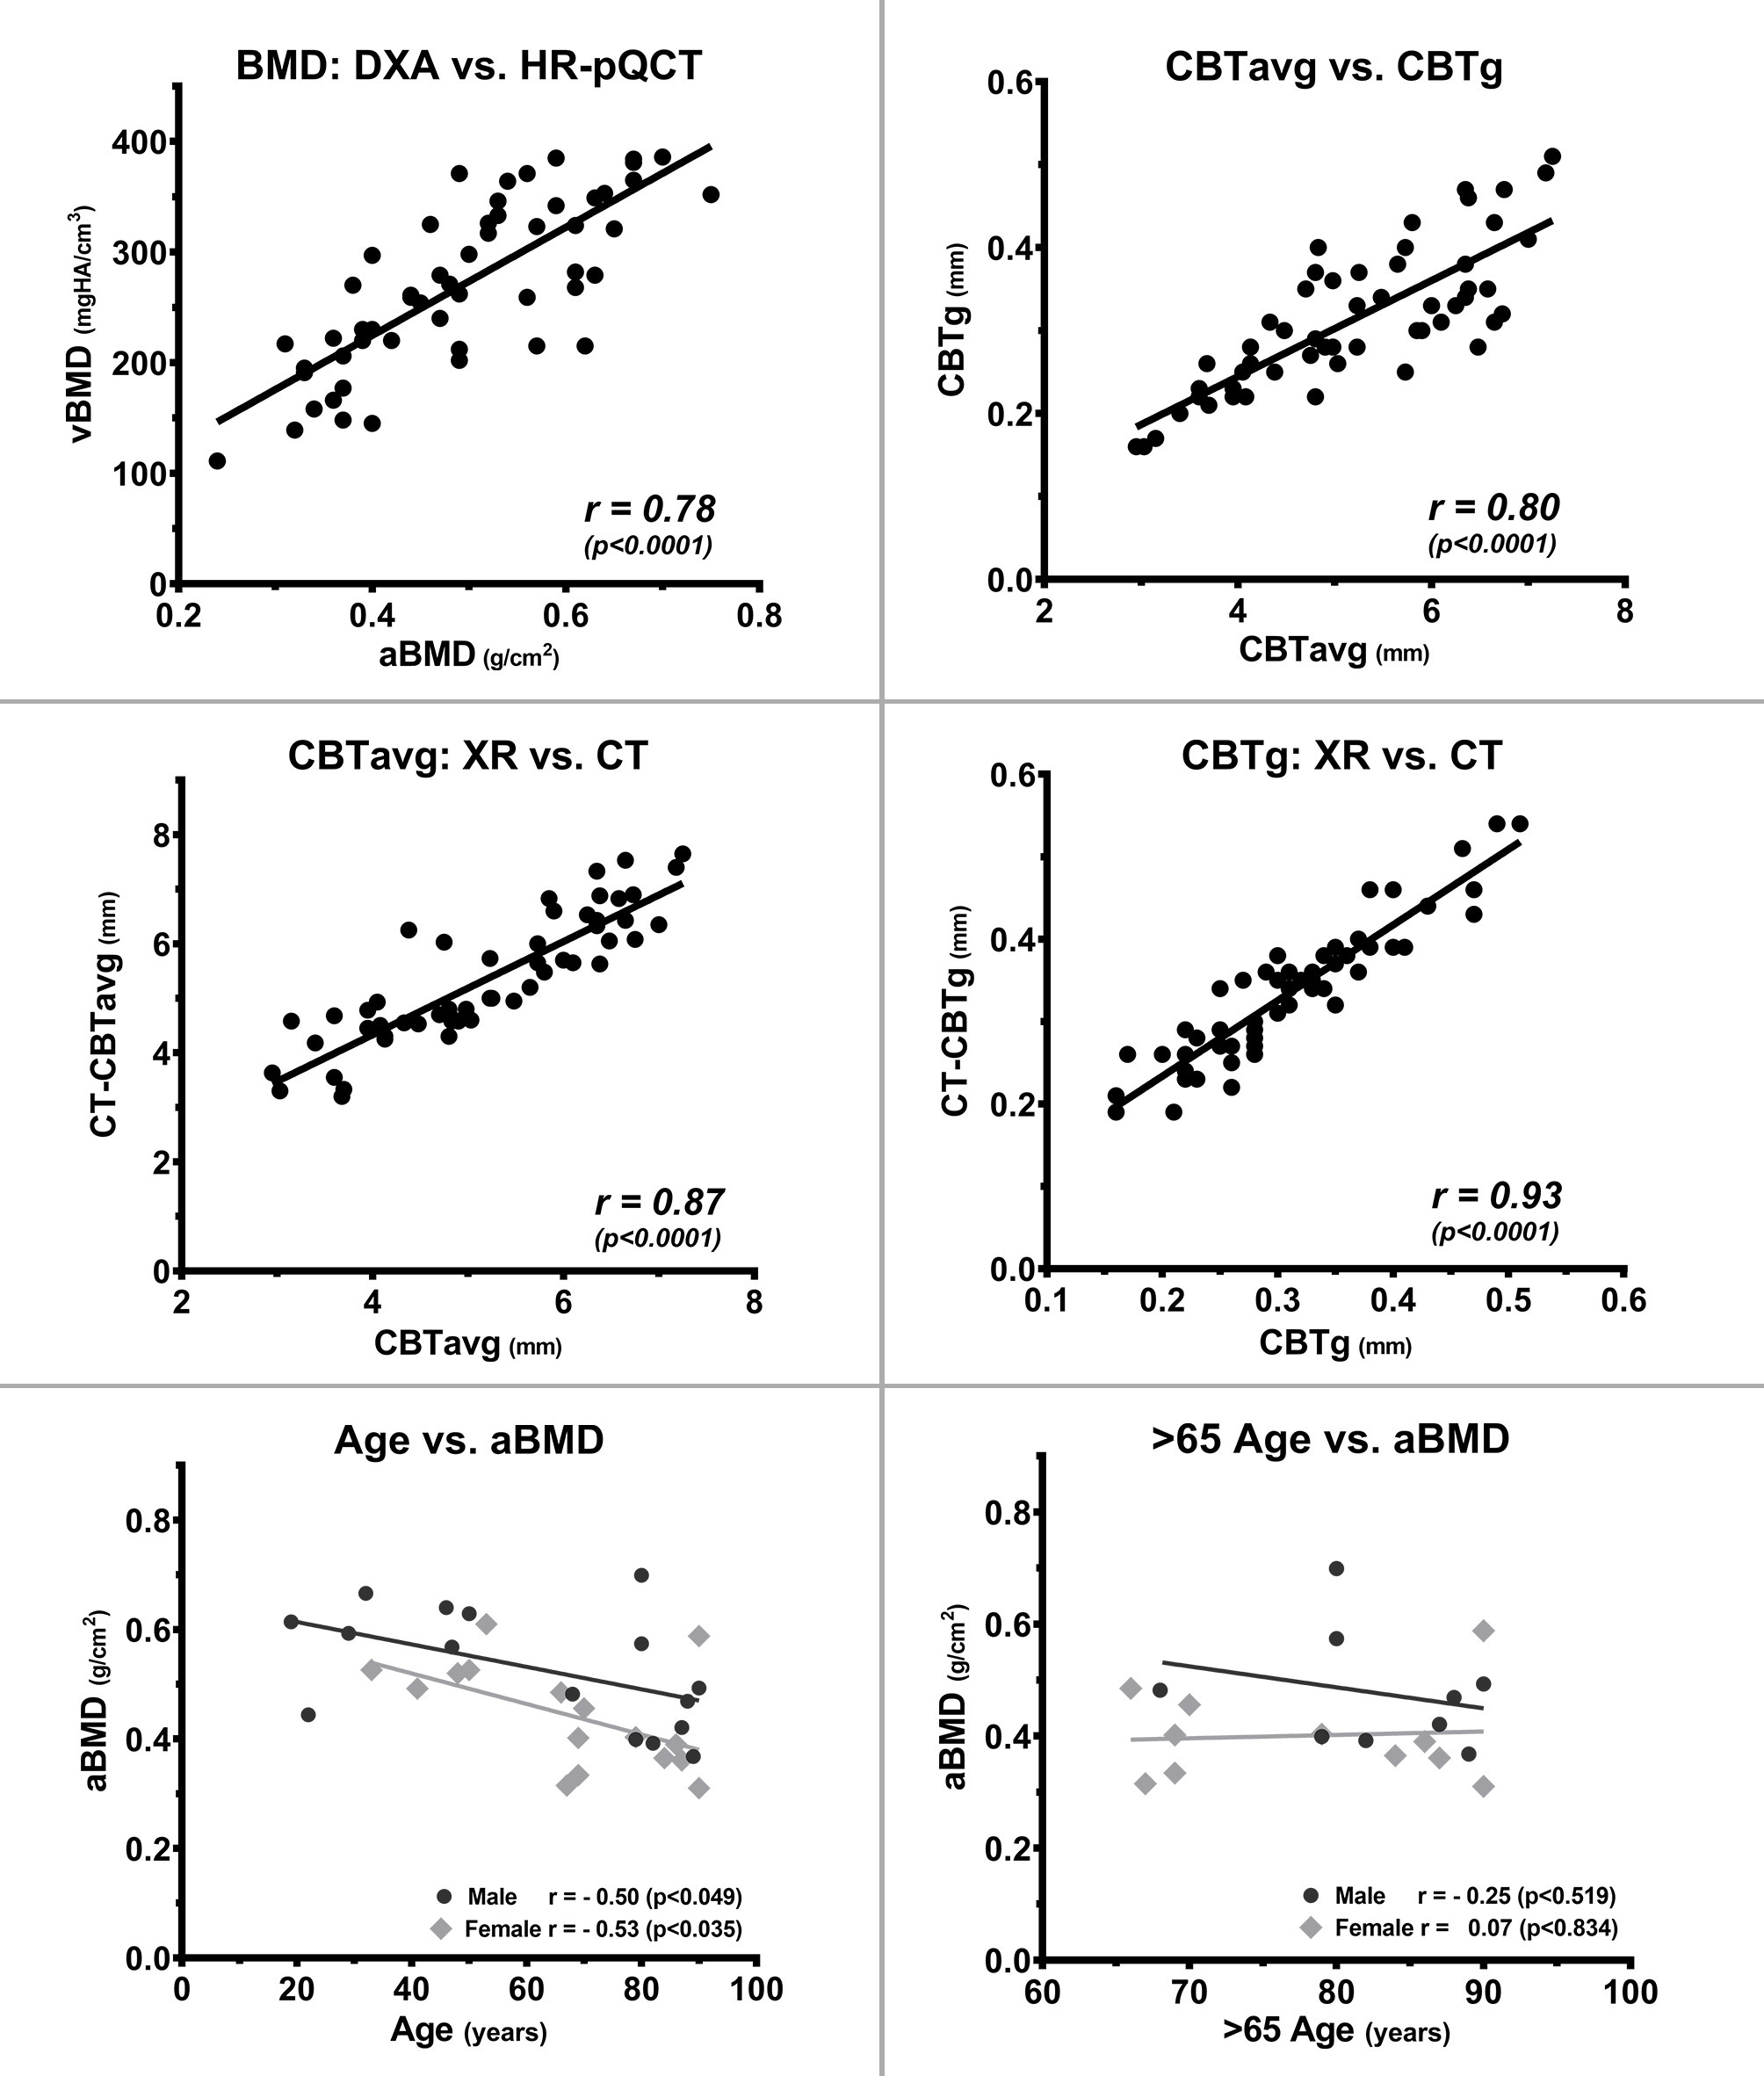
Fig. 4
Correlation of bone parameters of the radius with bone mineral density (BMD), cortical bone thickness (CBT), and age. Assessment of the radial BMD by dual-energy X-ray absorptiometry (DXA) (areal BMD (aBMD)) and high-resolution peripheral quantitative CT (HR-pQCT) (volumetric BMD (vBMD)) shows a high degree of correlation between both methods. The cortical indices of mean average CBT (CBTavg) and gauge CBT (CBTg), as well as the radiograph (XR) and CT measurements for CBTavg and CBTg, also show a high degree of correlation, proving that CBT measurements can reliably be performed from standard XRs. In contrast, age has only a low predictive value for radial aBMD and has no predictive value in the age group > 65 years. All p-values calculated using two-tailed Pearson correlation coefficient.
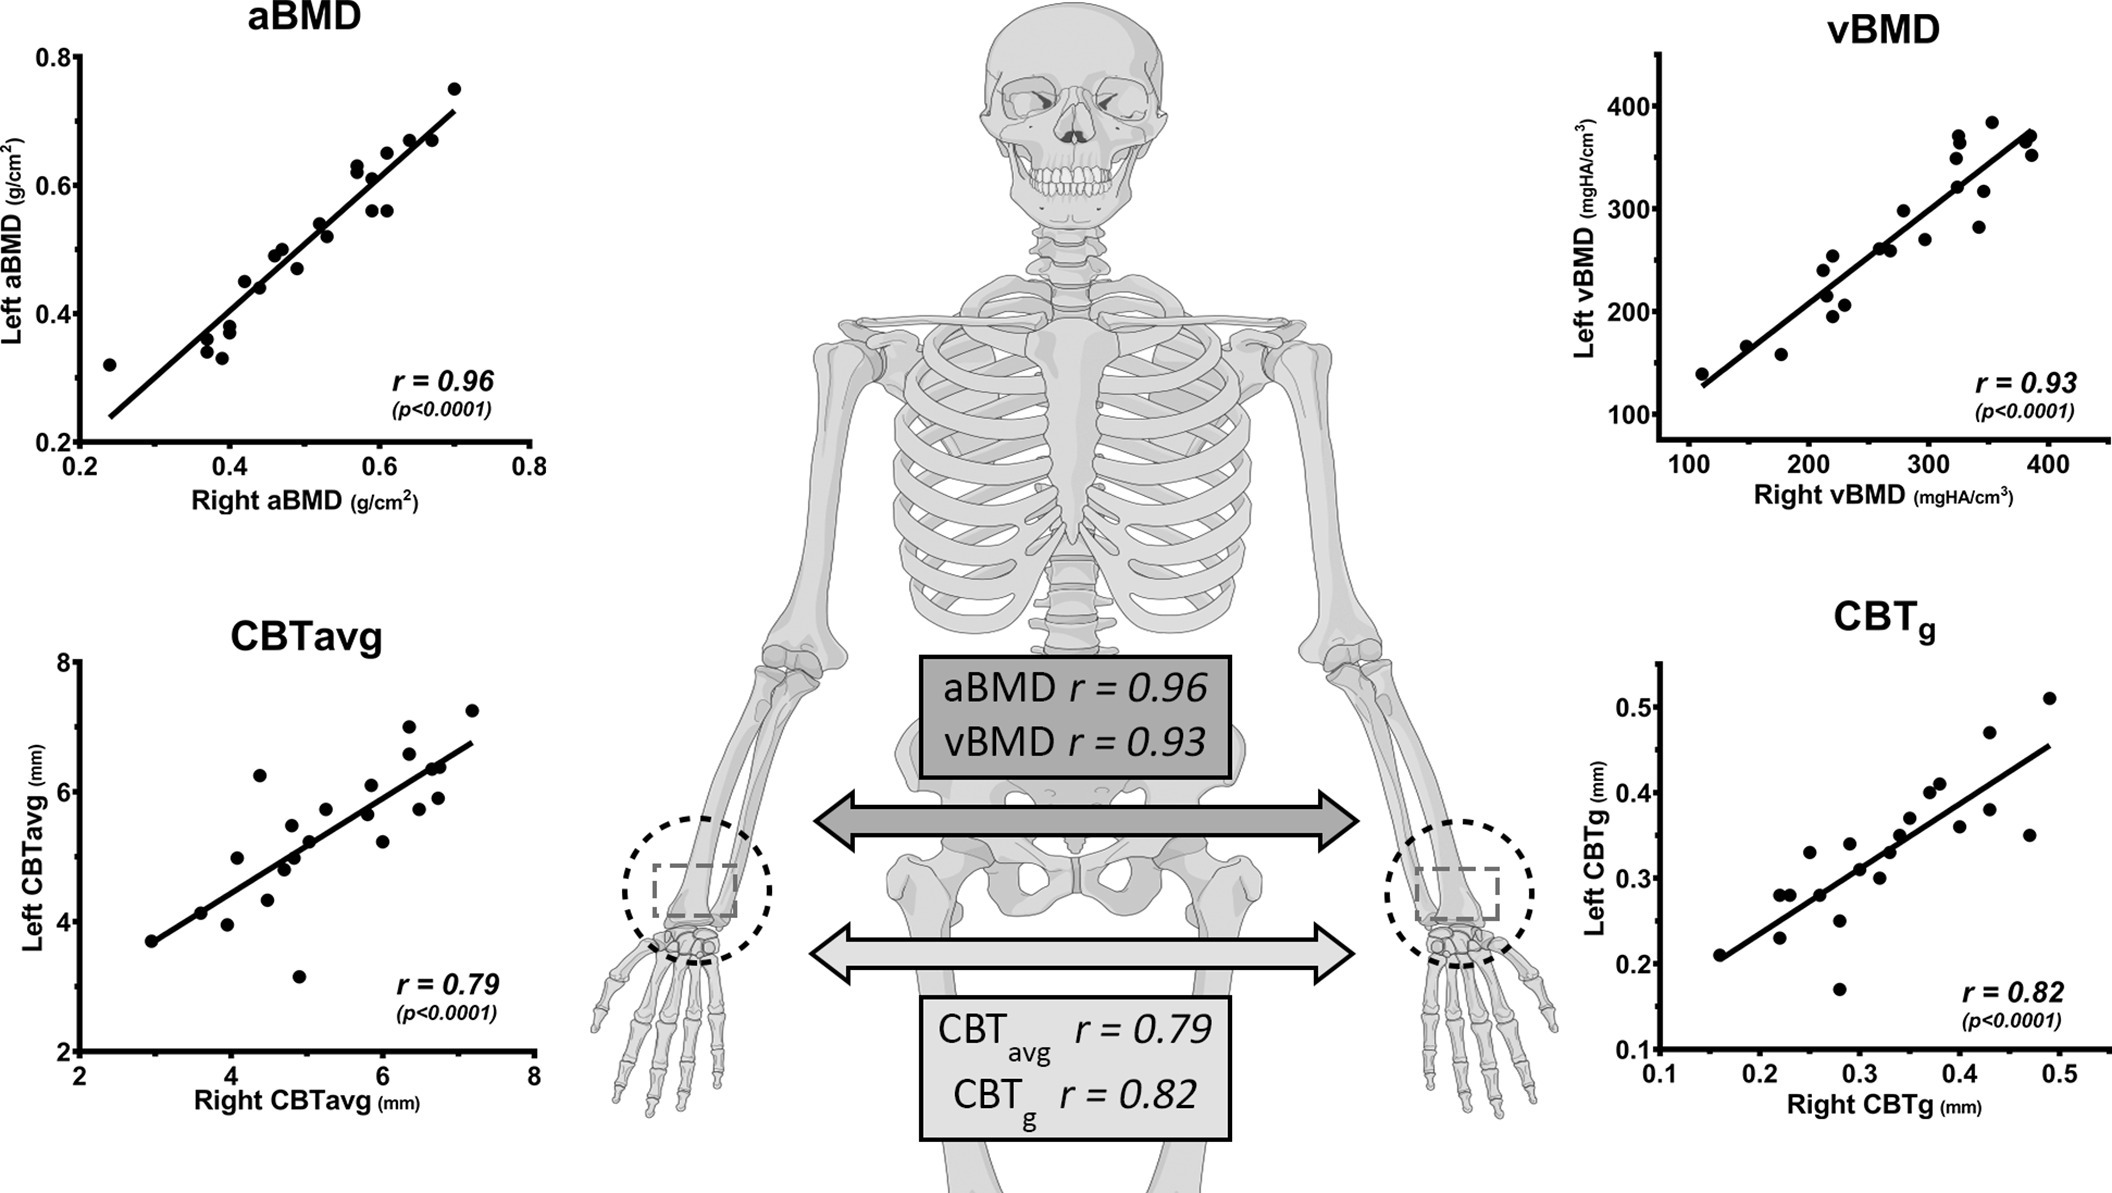
Fig. 5
Left and right distal radius with a high correlation for bone mineral density (BMD) and cortical bone thickness (CBT), where the contralateral side can serve as a reference if direct measurement is impeded (illustration provided by AO Surgery Reference25). aBMD, areal bone mineral density; CBTavg, mean average CBT; CBTg, gauge CBT; vBMD, volumetric bone mineral density. All p-values calculated using two-tailed Pearson correlation coefficient.
Female specimens (mean age 68 years (SD 18)) had a lower mean aBMD of 0.44 g/cm2 (SD 0.10) compared to 0.53 g/cm2 (SD 0.11) for the male specimens (mean age 62 years (SD 25)). The BMI did not show any correlation to the aBMD (r = 0.15; p = 0.416, Pearson correlation coefficient).
Age only moderately correlated with aBMD (r = −0.49; p < 0.004) and vBMD (r = -0.48; p < 0.006, both Pearson correlation coefficient) in the total collective of 32 individuals (Figure 4). Similarly, only moderate correlation between age and aBMD was observed for the male (r = −0.50; p < 0.049) and female (r = −0.53; p < 0.035, both Pearson correlation coefficient) specimens. For the individuals > 65 years of age, no correlation between age and aBMD (r = 0.11; p = 0.651) or vBMD (r = -0.23; p = 0.339, Pearson correlation coefficient) was found (Figure 4).
Correlation of the cortical indices
CBT data from XR highly correlated to those from the CT (CBTavg: r = 0.87; and CBTg: r = 0.93; both p < 0.001), indicating a high validity for the XR measurements (Figure 4). The indices, CBTavg and CBTg, showed a high degree of correlation (r = 0.80, p < 0.001) (Figure 4). Comparison between the left and right side of the 22 paired specimens revealed a high degree of correlation for the CBTavg (r = 0.79) and CBTg (r = 0.82; both p < 0.001, all Pearson correlation coefficient) (Figure 5).
Age only moderately correlated with CBTavg (r = −0.34; p = 0.011), which was similarly observed for male (r = −0.37; p < 0.055) or female specimens (r = −0.28; p < 0.176) (Figure 6). For individuals > 65 years of age, no correlation between age and CBTavg (r = 0.24; p = 0.181) was observed. The BMI did not show any correlation to the CBTavg (r = −0.04; p = 0.832, all Pearson correlation coefficient).
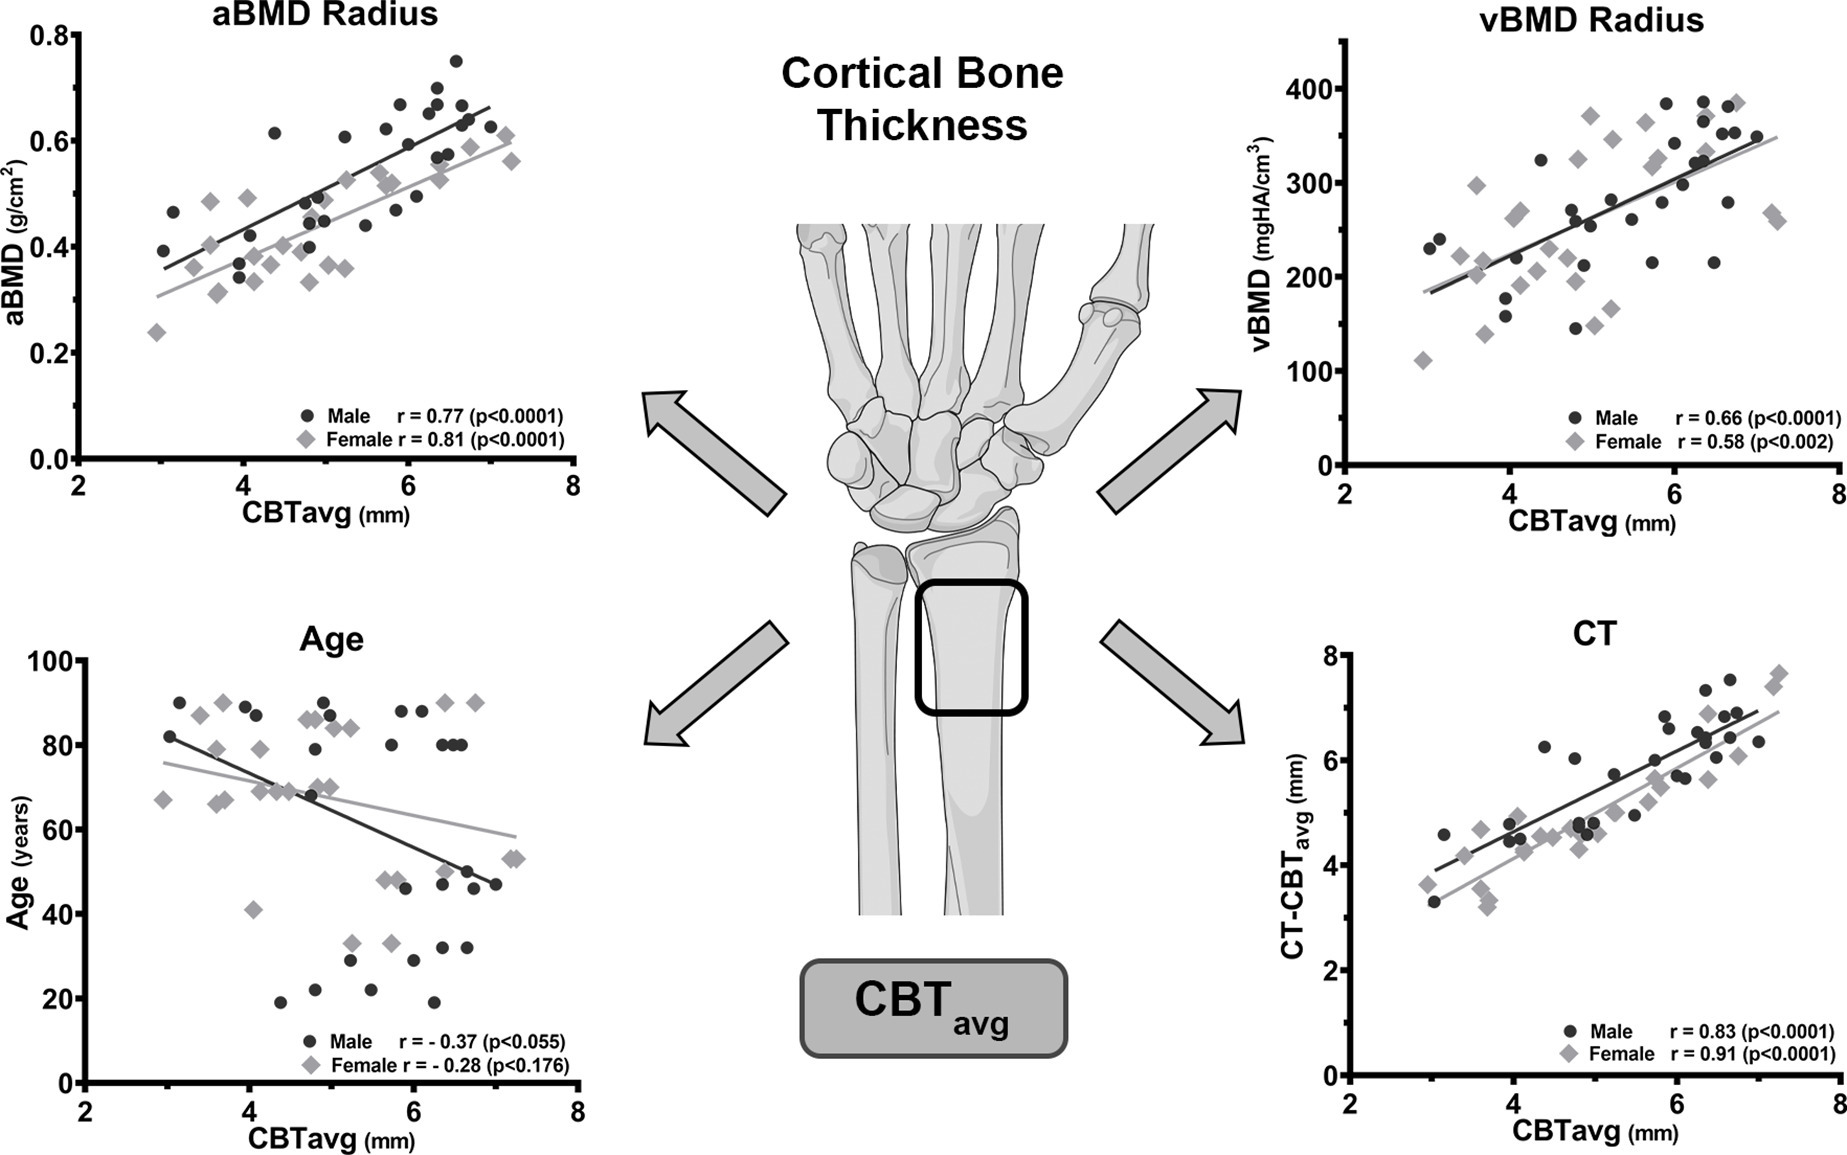
Fig. 6
Correlation of the mean average cortical bone thickness (CBTavg) with areal bone mineral density (aBMD), volumetric BMD (vBMD), age, and CT measurement. The high correlation of CBTavg with aBMD and vBMD enables prediction of the radial BMD if quantitative measurements are unavailable. In contrast, age is a weak predictor for CBTavg and has no predictive value in the age group > 65 years. The high correlation of the CBTavg with the CT measured CT-CBTavg confirms the reliable determination from standard radiographs (illustration provided by AO Surgery Reference25). All p-values calculated using two-tailed Pearson correlation coefficient.
The radial CBTavg from XR showed a good correlation of r = 0.78 with the aBMD (DXA) and moderate correlation of r = 0.63 with the vBMD (HR-pQCT) (both p < 0.001), which was similar for male and female specimens (Figure 6). The radial CT-CBTavg from CT correlated with the aBMD (DXA) r = 0.83 and the vBMD (HR-pQCT) r = 0.58 (both p < 0.001, all Pearson correlation coefficient).
The radial CBTg from XR showed a moderate correlation of r = 0.55 with the aBMD (DXA) and moderate correlation of r = 0.64 with the vBMD (HR-pQCT) (both p < 0.001). The radial CT-CBTg from CT correlated with the aBMD (DXA) r = 0.60 and the vBMD (HR-pQCT) r = 0.65 (both p < 0.001, all Pearson correlation coefficient).
Intra- and interobserver reliability
The ICCs showed that (CT)-CBTavg and (CT)-CBTg were determined with excellent intra- and interobserver reliability (0.83 to 0.92 and 0.79 to 0.86, respectively; both p < 0.001).
The intraobserver reliability of the two observers (CS and SGY) between the first and second measurement for the CBTavg and CBTg ranged from 0.83 to 0.89 (95% confidence interval (95% CI) 0.70 to 0.94), and for the CT-CBTavg and CT-CBTg ranged from 0.86 to 0.92 (95% CI 0.75 to 0.95).
The interobserver reliability between the two observers of the first measurements was 0.83 (95% CI 0.71 to 0.90) and 0.81 (95% CI 0.67 to 0.89) for the CBTavg and CBTg, respectively, and 0.86 (95% CI 0.75 to 0.92) and 0.79 (95% CI 0.64 to 0.88) for the CT-CBTavg and CT-CBTg, respectively.
Discussion
The present study demonstrates that the CBT of the distal radius can reliably be measured on standard XRs and predict the local BMD. The cortical CBTavg showed better results compared to the CBTg index and revealed a good-to-excellent correlation to the quantitative BMD measurements obtained by DXA (aBMD: r = 0.78) and by HR-pQCT (vBMD: r = 0.63).
Our results are in line with studies indicating a correlation of the radial CBT with the local BMD.16,22,23 Rausch et al22 evaluated the cortical thickness of the distal radius from six donors and found a high correlation to the local aBMD (r = 0.71). Saville16 measured the thickness at the radial shaft and found it capable to predict osteoporosis in patients with rheumatoid arthritis. Webber et al23 determined a CI in women with a distal radius fracture over 50 years and reported a positive correlation with the bone quality. However, only a low correlation was observed to the aBMD of the hip (r = 0.39) and no correlation to the lumbar spine (r = 0.02). The difference can be referred to the comparison of different skeleton sites, especially between the upper limb and the weight-bearing axial skeleton or lower limb. Several studies confirmed the high variability of the BMD along the different sites of the body, emphasizing the need to evaluate the upper limb separately.26-28
For the proximal humerus the measurement of the CBT has previously been found capable to predict the bone quality.17,18,20,29 Tingart et al18 and Spross et al17 reported a high correlation (r = 0.69 to 0.84) of a humeral CI to the local BMD, which is similar to our results at the distal radius. Lower correlations were described by Mather et al20 when comparing humeral cortical indices with the common clinical DXA sites, the proximal femur and the lumbar spine. These findings can again be referred to the individual differences between weight-bearing and non-weight-bearing sites. Similarly, Krappinger et al27 assumed that the BMD of other skeleton sites does not necessarily reflect the bone quality at the humeral fracture side. Wilson et al28 showed that BMD measurements in the upper limb are significantly lower than those in the lumbar spine and femur. Therefore, they emphasized that measurement of the BMD within the axial skeleton and lower limb alone may underestimate osteoporosis and the fracture risk in the upper limb.28 Groll et al26 found a high degree of heterogeneity between the trabecular bone of the radius and lower limb, where they recommended to determine the BMD directly at the site of interest and if not assessable at the contralateral side. Therefore the BMD should be directly measured at the radius or the contralateral radius, but not at the lower limb. This recommendation is supported by our data, showing the high coincidence of the radial BMD and CBT in paired specimens.
Comparison of the CBT measurements from plain XRs to those from the 3D CT scans revealed an excellent correlation (r = 0.87 and r = 0.93). Moreover, in line with previous CBT studies an excellent inter- and intraobserver agreement was observed,14,17,18,20 where CBT measurements at the distal radius can be regarded as a reliable and reproducible method. Notably, CBTavg achieved clearly higher correlations to the BMD than the CBTg which has similarly been reported for the humerus and tibia,15,20 and thus is the recommended index by Patterson et al15 and Mather et al.20
Distal radius fractures represent an early and sensitive marker for skeletal fragility and are associated with a high risk of further hip or vertebral fractures.30-34 This emphasizes the necessity for an increased attention to the distal radius for the possibility of fragility fractures,35 and initiate timely assessment of the lumbar and hip BMD and evaluate the possible necessity of a medical treatment. In this context, it has to be noted that osteoporotic agents like bisphosphonate are especially effective to increase the BMD of the lumbar spine and have less effect on the distal radius,36 whereas Denosumab and Teriparatide were also found to be effective for increasing radial BMD.37,38
Although the local bone quality has a high prognostic relevance in radius fractures, the impact of the CI to predict complications remains controversial. Hepp et al14 found a correlation between a CI with the occurrence of humeral fractures, but did not find an increased revision risk. In contrast, Carbone and Papalia39 described a correlation between a CI and the amount of impaction and loss of reduction in plated humeral fractures. For distal radius fractures, Daniels et al40 found a lower vBMD and cortical thickness to be independently associated with a higher risk for secondary displacement.
The main reason for the higher fracture and complication rate can be attributed to the microstructural bone remodelling of the cortical bone. It is well known for the distal radius that osteoporotic bone remodelling results in a reduced CBT, increased porosity, and consequently a compromised resistance.41 Pistoia et al42 showed that the cortex of the distal radius carries the main load and reduction of the CBT had the greatest impact on bone resistance. In accordance, clinical HR-pQCT studies have clearly proved the association of a compromised cortex with an increased fracture risk.43,44 The importance of the cortical bone is further underlined by the fact that 80% of the fragility fractures involve the appendicular skeleton, and the cortical bone loss accounts for 70% of the total bone loss at these sites.41,45
A reduced radius cortex on conventional XRs should therefore be considered an alarming sign for all patients, not only in those who already sustained a fracture. Therefore, several authors consider the cortical indices to be an inexpensive and rapid screening tool.18,23,27 Nevertheless, it remains undisputed that quantitative BMD measurements remain the gold standard, which refers even more to the monitoring and treatment of osteoporosis. However, in many countries worldwide the availability of DXA is still limited and hardly accessible in acute medical care facilities. A CI could serve as a rapid and inexpensive assessment tool for the local bone quality and provide valuable information for an enhanced decision-making process, such as conservative versus operative therapy or the type of surgical fixation.
This study has obvious limitations which are closely related to the in vivo study design with extensive and high-resolution imaging (DXA, XR, CT, HR-pQCT). First, a limited number of specimens was assessed and further clinical studies should include a larger pool of samples which also allows focus on differences such as sex and age. Second, we are not able to give a statement about the actual fracture risk, as we only evaluated intact radii. Further biomechanical and cohort studies should evaluate if this method is capable of identifying patients at risk. Third, all XRs were equipped with a calibration device which might differ to the local clinical setting. Fourth, we did not determine a cutoff value for ruling out osteoporosis as we believe that this should instead be evaluated in a larger cohort.
In conclusion, this study demonstrates that a CI at the distal radius can reliably be determined on standard XRs and highly correlates with the local BMD. It is a simple initial screening tool method which can serve to estimate the local bone quality, in order to enhance decision-making on fracture management or identify patients requiring further quantitative BMD measurements.
References
1. Ruiz-Adame M , Correa M . A systematic review of the indirect and social costs studies in fragility fractures . Osteoporos Int . 2020 ; 31 ( 7 ): 1205 – 1216 . Crossref PubMed Google Scholar
2. Abar O , Dharmar S , Tang SY . The effect of aminoguanidine (AG) and pyridoxamine (PM) on ageing human cortical bone . Bone Joint Res . 2018 ; 7 ( 1 ): 105 – 110 . Crossref PubMed Google Scholar
3. Peng X , Wu X , Zhang J , Zhang G , Li G , Pan X . The role of CKIP-1 in osteoporosis development and treatment . Bone Joint Res . 2018 ; 7 ( 2 ): 173 – 178 . Crossref PubMed Google Scholar
4. Rosen CJ . The Epidemiology and Pathogenesis of Osteoporosis In : Feingold K , Anawalt B , Boyce A . Endotext . South Dartmouth, Massachusetts : MDText.com, Inc . 2000 . Google Scholar
5. Wong RMY , Choy MHV , Li MCM , et al. A systematic review of current osteoporotic metaphyseal fracture animal models . Bone Joint Res . 2018 ; 7 ( 1 ): 6 – 11 . Crossref PubMed Google Scholar
6. Borgstrom F , Karlsson L , Ortsater G , et al. Fragility fractures in Europe: burden, management and opportunities . Arch Osteoporos . 2020 ; 15 ( 1 ): 59 . Crossref PubMed Google Scholar
7. Cadarette SM , Gignac MA , Jaglal SB , Beaton DE , Hawker GA . Access to osteoporosis treatment is critically linked to access to dual-energy X-ray absorptiometry testing . Med Care . 2007 ; 45 ( 9 ): 896 – 901 . Crossref PubMed Google Scholar
8. Curtis JR , Laster A , Becker DJ , et al. The geographic availability and associated utilization of dual-energy X-ray absorptiometry (DXA) testing among older persons in the United States . Osteoporos Int . 2009 ; 20 ( 9 ): 1553 – 1561 . Crossref PubMed Google Scholar
9. Rosenauer R , Pezzei C , Quadlbauer S , et al. Complications after operatively treated distal radius fractures . Arch Orthop Trauma Surg . 2020 ; 140 ( 5 ): 665 – 673 . Crossref PubMed Google Scholar
10. Skou ST , Juhl CB , Hare KB , Lohmander LS , Roos EM . Surgical or non-surgical treatment of traumatic skeletal fractures in adults: systematic review and meta-analysis of benefits and harms . Syst Rev . 2020 ; 9 ( 1 ): 179 . Google Scholar
11. Schousboe JT , Riekkinen O , Karjalainen J . Prediction of hip osteoporosis by DXA using a novel pulse-echo ultrasound device . Osteoporos Int . 2017 ; 28 ( 1 ): 85 – 93 . Crossref PubMed Google Scholar
12. Karjalainen JP , Riekkinen O , Kroger H . Pulse-echo ultrasound method for detection of post-menopausal women with osteoporotic BMD . Osteoporos Int . 2018 ; 29 ( 5 ): 1193 – 1199 . Crossref PubMed Google Scholar
13. He Q-F , Sun H , Shu L-Y , et al. Radiographic predictors for bone mineral loss: cortical thickness and index of the distal femur . Bone Joint Res . 2018 ; 7 ( 7 ): 468 – 475 . Crossref PubMed Google Scholar
14. Hepp P , Theopold J , Osterhoff G , Marquass B , Voigt C , Josten C . Bone quality measured by the radiogrammetric parameter "cortical index" and reoperations after locking plate osteosynthesis in patients sustaining proximal humerus fractures . Arch Orthop Trauma Surg . 2009 ; 129 ( 9 ): 1251 – 1259 . Crossref PubMed Google Scholar
15. Patterson J , Rungprai C , Den Hartog T , et al. Cortical bone thickness of the distal part of the tibia predicts bone mineral density . J Bone Joint Surg Am . 2016 ; 98-A ( 9 ): 751 – 760 . Crossref PubMed Google Scholar
16. Saville PD . A quantitative approach to simple radiographic diagnosis of osteoporosis: its application to the osteoporosis of rheumatoid arthritis . Arthritis Rheum . 1967 ; 10 ( 5 ): 416 – 422 . Crossref PubMed Google Scholar
17. Spross C , Kaestle N , Benninger E , et al. Deltoid Tuberosity Index: A Simple Radiographic Tool to Assess Local Bone Quality in Proximal Humerus Fractures . Clin Orthop Relat Res . 2015 ; 473 ( 9 ): 3038 – 3045 . Crossref PubMed Google Scholar
18. Tingart MJ , Apreleva M , von Stechow D , Zurakowski D , Warner JJ . The cortical thickness of the proximal humeral diaphysis predicts bone mineral density of the proximal humerus . J Bone Joint Surg Br . 2003 ; 85-B ( 4 ): 611 – 617 . Crossref PubMed Google Scholar
19. Wilczek ML , Kalvesten J , Algulin J , Beiki O , Brismar TB . Digital X-ray radiogrammetry of hand or wrist radiographs can predict hip fracture risk--a study in 5,420 women and 2,837 men . Eur Radiol . 2013 ; 23 ( 5 ): 1383 – 1391 . Crossref PubMed Google Scholar
20. Mather J , MacDermid JC , Faber KJ , Athwal GS . Proximal humerus cortical bone thickness correlates with bone mineral density and can clinically rule out osteoporosis . J Shoulder Elbow Surg . 2013 ; 22 ( 6 ): 732 – 738 . Crossref PubMed Google Scholar
21. Skedros JG , Mears CS , Burkhead WZ . Ultimate fracture load of cadaver proximal humeri correlates more strongly with mean combined cortical thickness than with areal cortical index, DEXA density, or canal-to-calcar ratio . Bone Joint Res . 2017 ; 6 ( 1 ): 1 – 7 . Crossref PubMed Google Scholar
22. Rausch S , Klos K , Gras F , et al. Utility of the cortical thickness of the distal radius as a predictor of distal-radius bone density . Arch Trauma Res . 2013 ; 2 ( 1 ): 11 – 15 . Crossref PubMed Google Scholar
23. Webber T , Patel SP , Pensak M , Fajolu O , Rozental TD , Wolf JM . Correlation between distal radial cortical thickness and bone mineral density . J Hand Surg Am . 2015 ; 40 ( 3 ): 493 – 499 . Crossref PubMed Google Scholar
24. Laib A , Hauselmann HJ , Ruegsegger P . In vivo high resolution 3D-QCT of the human forearm . Technol Health Care . 1998 ; 6 ( 5-6 ): 329 – 337 . PubMed Google Scholar
25. No authors listed . AO Surgery Reference . 2021 . https://surgeryreference.aofoundation.org ( date last accessed 15 June 2021 ). Google Scholar
26. Groll O , Lochmuller EM , Bachmeier M , Willnecker J , Eckstein F . Precision and intersite correlation of bone densitometry at the radius, tibia and femur with peripheral quantitative CT . Skeletal Radiol . 1999 ; 28 ( 12 ): 696 – 702 . Crossref PubMed Google Scholar
27. Krappinger D , Roth T , Gschwentner M , et al. Preoperative assessment of the cancellous bone mineral density of the proximal humerus using CT data . Skeletal Radiol . 2012 ; 41 ( 3 ): 299 – 304 . Crossref PubMed Google Scholar
28. Wilson J , Bonner TJ , Head M , Fordham J , Brealey S , Rangan A . Variation in bone mineral density by anatomical site in patients with proximal humeral fractures . J Bone Joint Surg Br . 2009 ; 91-B ( 6 ): 772 – 775 . Crossref PubMed Google Scholar
29. Giannotti S , Bottai V , Dell'osso G , et al. Indices of risk assessment of fracture of the proximal humerus . Clin Cases Miner Bone Metab . 2012 ; 9 ( 1 ): 37 – 39 . PubMed Google Scholar
30. Ettinger B , Ray GT , Pressman AR , Gluck O . Limb fractures in elderly men as indicators of subsequent fracture risk . Arch Intern Med . 2003 ; 163 ( 22 ): 2741 – 2747 . Crossref PubMed Google Scholar
31. Haentjens P , Autier P , Collins J , Velkeniers B , Vanderschueren D , Boonen S . Colles fracture, spine fracture, and subsequent risk of hip fracture in men and women. A meta-analysis . J Bone Joint Surg Am . 2003 ; 85-A ( 10 ): 1936 – 1943 . Crossref PubMed Google Scholar
32. Haentjens P , Johnell O , Kanis JA , et al. Evidence from data searches and life-table analyses for gender-related differences in absolute risk of hip fracture after Colles' or spine fracture: Colles' fracture as an early and sensitive marker of skeletal fragility in white men . J Bone Miner Res . 2004 ; 19 ( 12 ): 1933 – 1944 . Crossref PubMed Google Scholar
33. Schnell AD , Curtis JR , Saag KG . Importance of recent fracture as predictor of imminent fracture risk . Curr Osteoporos Rep . 2018 ; 16 ( 6 ): 738 – 745 . Crossref PubMed Google Scholar
34. Schousboe JT , Fink HA , Taylor BC , et al. Association between self-reported prior wrist fractures and risk of subsequent hip and radiographic vertebral fractures in older women: a prospective study . J Bone Miner Res . 2005 ; 20 ( 1 ): 100 – 106 . Crossref PubMed Google Scholar
35. Crandall CJ , Hovey KM , Cauley JA , et al. Wrist Fracture and Risk of Subsequent Fracture: Findings from the Women’s Health Initiative Study . J Bone Miner Res . 2015 ; 30 ( 11 ): 2086 – 2095 . Google Scholar
36. Iba K , Takada J , Sonoda T , Yamashita T . Effect of continuous long-term treatment for 10 years with bisphosphonate on Japanese osteoporosis patients . J Bone Miner Metab . 2020 ; 38 ( 2 ): 240 – 247 . Google Scholar
37. Matsuno H . Assessment of distal radius bone mineral density in osteoporosis patients receiving denosumab, including those with rheumatoid arthritis and those receiving oral glucocorticoids . Drugs R D . 2016 ; 16 ( 4 ): 347 – 353 . Crossref PubMed Google Scholar
38. Nakayama H , Toho H , Sone T . Utility of radius bone densitometry for the treatment of osteoporosis with once-weekly teriparatide therapy . Osteoporos Sarcopenia . 2018 ; 4 ( 1 ): 29 – 32 . Crossref PubMed Google Scholar
39. Carbone S , Papalia M . The amount of impaction and loss of reduction in osteoporotic proximal humeral fractures after surgical fixation . Osteoporos Int . 2016 ; 27 ( 2 ): 627 – 633 . Crossref PubMed Google Scholar
40. Daniels AM , Janzing HMJ , Wyers CE , et al. Association of secondary displacement of distal radius fractures with cortical bone quality at the distal radius . Arch Orthop Trauma Surg . 2020 ; Epub ahead of print . Crossref PubMed Google Scholar
41. Bala Y , Zebaze R , Seeman E . Role of cortical bone in bone fragility . Curr Opin Rheumatol . 2015 ; 27 ( 4 ): 406 – 413 . Crossref PubMed Google Scholar
42. Pistoia W , van Rietbergen B , Ruegsegger P . Mechanical consequences of different scenarios for simulated bone atrophy and recovery in the distal radius . Bone . 2003 ; 33 ( 6 ): 937 – 945 . Crossref PubMed Google Scholar
43. Bala Y , Zebaze R , Ghasem-Zadeh A , et al. Cortical porosity identifies women with osteopenia at increased risk for forearm fractures . J Bone Miner Res . 2014 ; 29 ( 6 ): 1356 – 1362 . Crossref PubMed Google Scholar
44. Stein EM , Kepley A , Walker M , et al. Skeletal structure in postmenopausal women with osteopenia and fractures is characterized by abnormal trabecular plates and cortical thinning . J Bone Miner Res . 2014 ; 29 ( 5 ): 1101 – 1109 . Crossref PubMed Google Scholar
45. Zebaze RM , Ghasem-Zadeh A , Bohte A , et al. Intracortical remodelling and porosity in the distal radius and post-mortem femurs of women: a cross-sectional study . Lancet . 2010 ; 375 ( 9727 ): 1729 – 1736 . Crossref PubMed Google Scholar
Author contributions
F. Schmidutz: Conceptualization, Supervision, Writing – original draft.
C. Schopf: Investigation, Data curation.
S. G. Yan: Investigation, Data curation, Writing – review & editing.
M-D. Ahrend: Formal analysis, Writing – review & editing.
C. Ihle: Analyzed the data, Edited the manuscript.
C. M. Sprecher: Project administration, Resources, Writing – review & editing.
Funding statement
This work was funded by AO Trauma (Grant No. AR2012_01) and the AO Research Institute (ARI). No benefits in any form have been received or will be received from a commercial party related directly or indirectly to the subject of this article.
ICMJE COI statement
The authors declare that there are no conflicts of interest.
Acknowledgements
Graphical illustrations in the figures were kindly provided by AO Surgery Reference (www.aosurgery.org).
Ethical review statement
All specimens were collected post-mortem with appropriate consent of the donors during their lifetime or of their relatives and were handled according to the highest ethical standards. The study did not require ethical approval.
Open access funding
Open access funding was provided by Eberhard Karls University Tübingen and Siegfried-Weller-Institut (BG Unfallklinik Tübingen).
